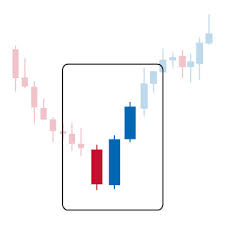
Bullish Reversals
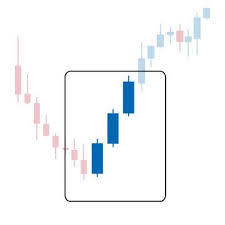
Bullish Continuation
Bearish Reversals
Bearish Continuation
Abandoned baby
Concealing Baby Swallow
Kicking
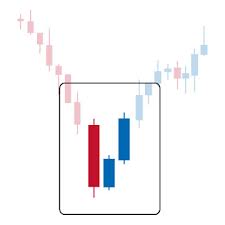
Morning Doji Star
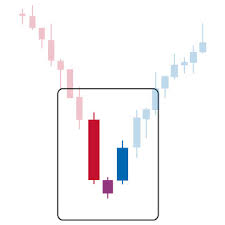
Morning star
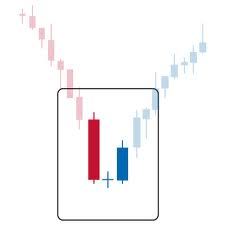
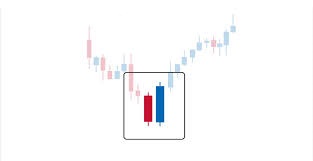
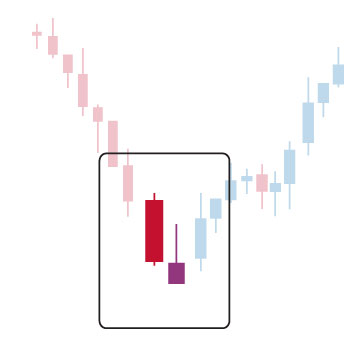
Piercing Line
3 Inside-Up Pattern
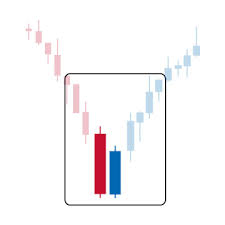
3 Outside-Up
3 White Soldiers
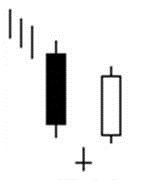
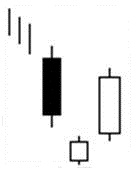
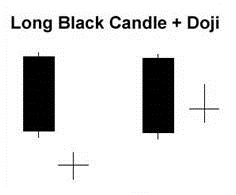
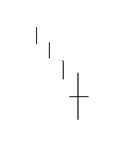
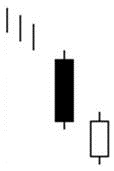
- Market is characterised by downtrend.
- We usually see a long black candlestick in the first day.
- Then a Doji appears on the second day whose shadows gap below the previous day's lower shadow and gaps in the direction of the previous downtrend.
- Then we see a white candlestick on the third day with a gap in the opposite direction with no overlapping shadows.
Bullish Abandoned Baby:
The Bullish Abandoned Baby pattern is a very rare bottom reversal signal that is similar to
the Morning Star pattern and almost the same as the Morning Doji Star.
The difference is that the shadows on the Doji must gap below the shadows of the first
and third days for the Abandoned Baby bottom.
We have a similar scenario that is valid for most of the three-day star patterns. In a falling market,
the market shows bearish strength first with a long black candlestick and opens with a gap on the second day.
The second day trading is within a small range and second day closes at or very near its open.
This now suggests the potential for a rally showing that positions are changed.
The signal of trend reversal is given by the white third day and by well-defined upward gap.
- The Bullish Abandoned Baby pattern is quite rare.
- The reliability of this pattern is very high, but still a confirmation in the form of a white candlestick with a higher close or a gap-up is suggested.
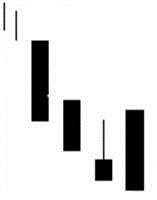
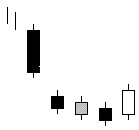
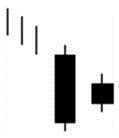
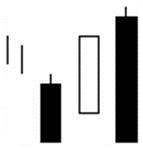
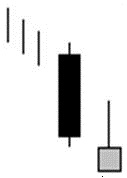
- Market is characterized by a downtrend.
- We see two consecutive Black Marubozu on the first and second days.
- Then we see a black candlestick on the third day opening with a downward gap but trading into the body of the second day and it is characterized by a long upper shadow.
- Finally we see another Black Marubozu on the fourth day that completely engulfs the candlestick of the third day including the shadow.
Concealing Baby Swallow pattern: The Bullish Concealing Baby Swallow pattern consists of four candlesticks, which is highlighted by two consecutive Black Marubozu. They are characterized by the fact that a gapping black candlestick trades into the body of the previous day and it is seen during a downtrend. Then there is another Black Marubozu on the third day showing selling of positions since it closes at a new low. However, this may give incentive to the shorts to cover their positions implying that a bullish reversal is now possible.
Explanation: Two black Marubozu show that downtrend is continuing to the satisfaction of the bears or shorts. On the third day, we see a downward gap further confirming the downtrend. However, prices on the third day start going above the close of the previous day causing some doubts about the bearish direction even though the day closes at or near its low. The next day shows us a significantly higher gap in the opening. After the opening, however, prices again go down closing at a new low. This last day may be interpreted as a good chance for the short-sellers to cover their short positions. Strong short covering should propel the price upward in the coming days.
Important factors:- The reliability of this pattern is very high, but still a confirmation in the form of a white candlestick with a higher close or a gap-up is suggested.
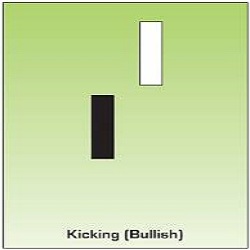
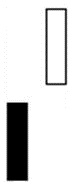
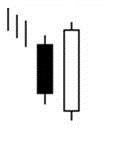
- Market direction is not important.
- We first see a Black Marubozu pattern.
- Then we see a White Marubozu that gaps upward on the second day.
Bullish Kicking: The Bullish Kicking pattern is a Black Marubozu followed by a White Marubozu. After the Black Marubozu, the market gaps sharply higher on the opening and it opens with a gap above the prior sessions opening thus forming a White Marubozu.
Explanation: This Bullish Kicking Pattern is a strong sign showing that the market is headed upward. The previous market direction is not important for this pattern unlike most other candle patterns. The market is headed up with the Bullish Kicking Pattern as the prices gap up the next day. The prices never enter into the previous day's range. Instead they close with another gap. The gap created by the second day becomes a support area. Expect higher prices and for the gap to be tested before breaking back to the downside.
Important factors:- We should be careful that both of the patterns do not have any shadows or they have only very small shadows (they both are Marubozu).
- The Bullish Kicking Pattern is somewhat similar to the Bullish Separating Lines Pattern.
- The opening prices are equal in Bullish Separating Lines Pattern, while in the Bullish Kicking Pattern a gap occurs.
- The Bullish Kicking Pattern is highly reliable, but still, a confirmation of the reversal on the third day should be sought. This confirmation may be in the form of a white candlestick, a large gap up or a higher close on the third day.
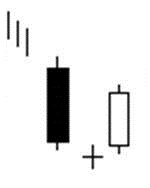
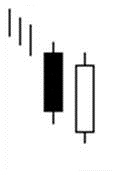
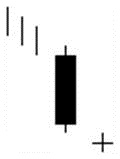
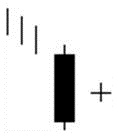
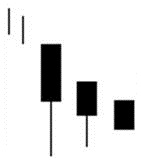
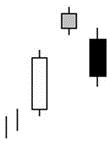
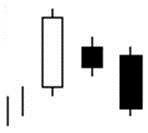
- Market is characterised by downtrend.
- We see a long black candlestick in the first day.
- Then we see a Doji on the second day that gaps in the direction of the previous downtrend.
- The white candlestick on the third day confirms the reversal.
Morning Doji Star: A Morning Doji Star is also a three-candlestick formation signaling a major bottom reversal. It is composed of a long black candlestick followed by a Doji, which characteristically gaps down to form a Doji star. Then we have a third white candlestick whose closing is well into the first session’s black real body. If the candlestick after the Doji star is black and gapped lower, the bullishness of the Doji is invalidated. It is more significant than the regular Morning Star pattern and is a meaningful bottom pattern.
Explanation: The black real body while the market is falling down may suggest that the bears are in command. Then a Doji appears showing the diminishing capacity of sellers to drive the market lower. Confirmation of bull ascendancy is the third day’s strong white real body. An ideal Bullish Morning Doji Star Pattern must have a gap before and after the middle line’s real body. The second gap is rare, but lack of it does not take away from the power of this formation.
Important factors:- The Doji may be more than one, two or even three.
- Doji gaps are not important.
- The reliability of the Morning Doji Star pattern is very high, but still a confirmation in the form of a white candlestick with a higher close or a gap-up is suggested.
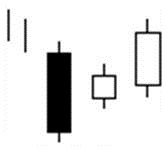
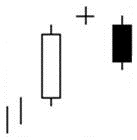
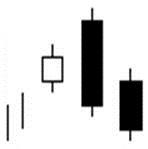
- Market is characterized by downtrend.
- A long black candlestick in the first day.
- Then a small body on the second day gapping in the direction of the previous downtrend.
- Finally we see a white candlestick on the third day.
Morning Star: Morning Star is a bullish bottom reversal pattern. The formation is comprised of three candlesticks. The first candlestick is a long black real body followed by the second, a small real body, which gaps (opens) lower (a star pattern). The third candlestick is a white real body that moves well into the first period's black real body. The third candle is the confirmation of the reversal and shows that the market has turned bullish now. It is named “Morning Star” because it appears in the morning before the sun rises. This is similar to an island pattern on standard bar charts.
Explanation: We see the black body in a falling market suggesting that the bears are in command. Then a small real body appears implying the incapacity of sellers to drive the market lower. The strong white body of the third day proves that bulls have taken over. An ideal Bullish Morning Star Pattern preferably has a gap before and after the middle candlestick. The second gap is rare, but lack of it does not take away from the power of this formation.
Important factors:- The stars may be more than one, two or even three.
- The colour of the star and its gaps are not important.
- The reliability of this pattern is very high, but still a confirmation in the form of a white candlestick with a higher close or a gap-up is suggested.
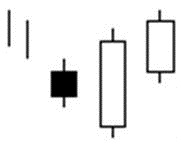
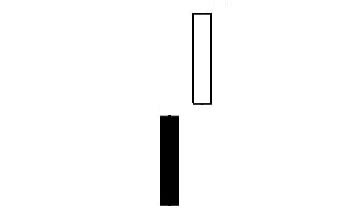
Piercing Line: The Bullish Piercing Line is a bottom reversal pattern, consisting of two day’s candlesticks. It is composed of a long black body followed by a gap lower during the next day, while the market is in downtrend. The day ends up as a strong white candlestick, which closes more than halfway into the prior black candlestick’s real body. It tells that the market opens lower on the opening and closes above the midpoint of the prior body. The Piercing Line is the opposite of the dark-cloud cover pattern.
Explanation: The market moves down in a downtrend. The first black real body reinforces this view. The next day the market opens lower via a gap. Everything now goes, as bears want it. However, suddenly the market surges toward the close, leading the prices to close sharply above the previous day close. Now the bears are losing their confidence and reevaluating their short positions. The potential buyers start thinking that new lows may not hold and perhaps it is time to take long positions.
Important factors:- In the Bullish Piercing Line pattern, the greater the degree of penetration into the black real body, the more likely it will be a bottom reversal. An ideal piercing pattern will have a real white body that pushes more than half way into the prior session’s black real body.
- In the Bullish Piercing Line pattern, the greater the degree of penetration into the black real body, the more likely it will be a bottom reversal. An ideal piercing pattern will have a real white body that pushes more than half way into the prior session’s black real body.
- A confirmation of the trend reversal by a white candlestick, a large gap up or by a higher close on the next trading day is suggested.
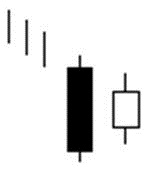
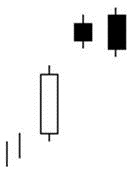
- Market is characterized by downtrend.
- We see a Bullish Harami Pattern in the first two days.
- Then we see a white candlestick on the third day with a higher close than the second day.
Three inside-up pattern: The Bullish Three Inside-Up Pattern is another name for the Confirmed Bullish Harami pattern. It consists of three days candlesticks with the third day being confirmation of the bullish trend reversal.
Explanation: The first two days of this pattern is simply the Bullish Harami Pattern, and the third day confirms the reversal suggested by the Bullish Harami Pattern, since it is a white candlestick closing with a new high for the last three days.
Important factors:- The reliability of the Bullish Three Inside-Up pattern is very high, but still a confirmation in the form of a white candlestick with a higher close or a gap-up is suggested.
- Market is characterized by a downtrend.
- We see a Bullish Engulfing Pattern in the first two days.
- The third day is a white candlestick with a higher close than the second day.
Three Outside-up pattern: The Bullish Three Outside-Up Pattern is simply another name for the Confirmed Bullish Engulfing Pattern. Again it consists of three day’s candlesticks with the third day being confirmation of the bullish trend reversal.
Explanation: The first two days of this three-day pattern is simply a Bullish Engulfing Pattern, and the third day confirms the reversal suggested by the Bullish Engulfing Pattern since it is a white candlestick closing with a new high for the last three days.
Important factors:- The reliability of the Bullish Three Outside-Up pattern is very high, but still a confirmation in the form of a white candlestick with a higher close or a gap-up is suggested.
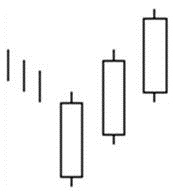
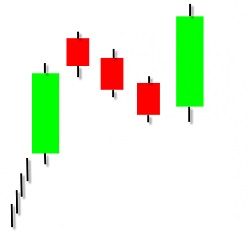
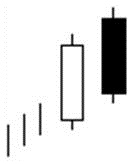
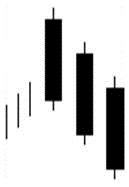
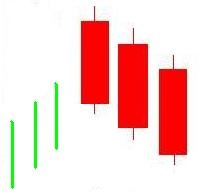
- Market is characterised by a downtrend.
- We see three consecutive long white candlesticks.
- Each candlestick closes at a new high.
- The opening of each candlestick is within the body of the previous day.
- Each consecutive day closes near or at its highs.
Three White Soldiers pattern: The Bullish Three White Soldiers pattern is indicative of a strong reversal in the market. It is characterised by three long candlesticks stepping upward like a staircase. The opening of each day is slightly lower than previous close rallying then to a short term high.
Important factors:- The opening prices of the second and third days can be anywhere within the previous day's body. However, it is better to see the opening prices above the middle of the previous day's body.
- If the white candlesticks are very extended, one should be cautious about an overbought market.
- The reliability of the Bullish Three White Soldiers pattern is very high, but still a confirmation in the form of a white candlestick with a higher close or a gap-up is suggested.
Doji general
Doji (01)
Doji (02)
Doji Star
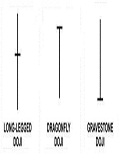
Dragonfly Doji
Gravestone Doji
Long-Legged Doji
Breakaway
Engulfing pattern
Harami Cross
Homing Pigeon
Ladder Bottom
Matching Low
Meeting Lines
Stick Sandwich
3 Stars in the South
Tri Star
Unique 3 River Bottom

Doji general:
- Doji - Doji are important candlesticks that provide information on their own and as components of in a number of important patterns.
- The Doji should have a very small body that appears as a thin line.
- Doji candlesticks have the same open and close price or at least their bodies are extremely short.
- Doji suggest indecision between buyers and sellers. Prices move above and below the open price during the session, but close at or very near the open price. Neither buyers nor sellers were able to gain control and the result was essentially a draw.
- There are four special types of Doji lines. The length of the upper and lower shadows can vary and the resulting candlestick looks like a cross, inverted cross or plus sign. The word "Doji" refers to both the singular and plural form.

Doji and other Candlesticks:
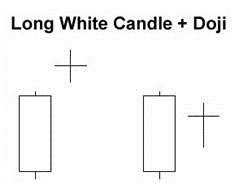
When a Doji forms on your chart, pay special attention to the preceding candlesticks.
If a Doji forms after a series of candlesticks with long hollow bodies (like white Marubozus), the Doji signals that the buyers are becoming exhausted
and weakening. In order for the price to continue rising, more buyers are needed but there are not anymore! Sellers are licking their chops
and are looking to come in and drive the price back down.
Keep in mind that even after a Doji forms, this does not mean to automatically go short.
Confirmation is still needed. Wait for a bearish candlestick to close below the long white candlestick’s open. If a Doji forms after a series of candlesticks
with long filled bodies (like black Marubozus), the Doji signals that sellers are becoming exhausted and weakening.
In order for the price to continue falling, more sellers are needed but sellers are all tapped out! Buyers are foaming in the mouth for a chance to get in cheap.
While the decline is sputtering due to lack of new sellers, further buying strength is required to confirm any reversal.
Look for a white candlestick to close above the long black candlestick’s open.
After a decline or long black candlestick, a Doji indicates that selling pressure may be diminishing and the downtrend could be nearing an end. Even though the bears
are starting to lose control of the decline, further strength is required to confirm any reversal. Bullish confirmation could come from a gap up, long white candlestick
or advance above the long black candlestick's open. After a long black candlestick and Doji, traders should be on the alert for a potential morning Doji star.
 Doji and other Candlesticks:
Idem (01)
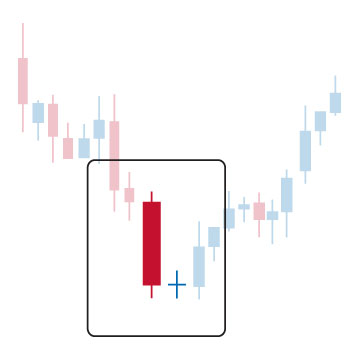
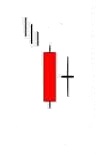
- Market is characterised by a downtrend.
- We see a long black candlestick on the first day.
- Then we see a short candlestick, a spinning top, or a Doji, that gaps in the direction of the previous trend on the second day.
- The shadows of this short candlestick, spinning top, or Doji are not long.
Bullish Doji Star: The Bullish Doji Star pattern is a short candlestick, a spinning top, which gaps from a long black candlestick during a downtrend.
Explanation: The downtrend is in full force with a strong first day. All confidence built up by the bears from the first day is destroyed when the second day's gap down closes near it's open. Usually a star that follows a long black candlestick in a downtrend indicates a change in the market environment. Bears or shorts were in control during the downtrend but now a change is implied by the appearance of a star that shows that the bulls and the bears are in equilibrium. The downward energy is dissipating. Things are not favourable for a continuation of a bear market and short covering will quickly appear if the next day opens higher.
Important factors:- A confirmation of the reversal on the third day is required. This confirmation of the trend reversal may be in the form of a white candlestick, a large gap up or a higher close on the next trading day (third day).
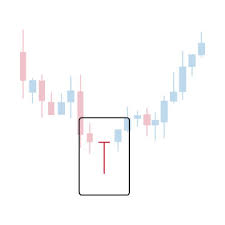
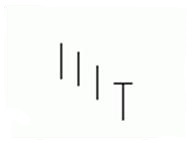
- There is an overall downtrend in the market.
- Then we see a Doji at the upper end of the trading range.
- The Doji has an extremely long lower shadow.
- However the Doji does not have any upper shadow.
Bullish Dragonfly Doji: The Bullish Dragonfly Doji pattern is a single candlestick pattern that occurs at the bottom of a trend or during a downtrend. The Bullish Dragonfly Doji pattern is very similar to the Bullish Hammer Pattern. The distinction between the two is if there is a body or not. In case of Bullish Dragonfly Doji pattern, the opening and closing prices are identical and there is no body. On the other hand the Bullish Hammer Pattern has a small real body at the upper end of the trading range. The Dragonfly Doji forms when the open, high and close are equal and the low creates a long lower shadow. The resulting candlestick looks like a "T" with a long lower shadow and no upper shadow. The Dragonfly Doji pattern indicates that sellers dominated trading and drove prices lower during the session. By the end of the session, buyers resurfaced and pushed prices back to the opening level and the session high. The reversal implications of a dragonfly Doji depend on previous price action and future confirmation. The long lower shadow provides evidence of buying pressure, but the low indicates that plenty of sellers still loom. After a long downtrend, long black candlestick, or at support, a dragon fly Doji could signal a potential bullish reversal or bottom. After a long uptrend, long white candlestick or at resistance, the long lower shadow could foreshadow a potential bearish reversal or top.
Explanation: The market is in an overall bearish mood characterised by a downtrend. Then market opens and sells off sharply. However, the sell-off is suddenly abated and the prices reverse direction and start going up for the rest of the day closing at or near the day’s high, thus leading to the long lower shadow. The failure of the market to continue on the selling side reduces the bearish sentiment. Now the shorts are increasingly becoming uneasy with their bearish positions. If the market opens higher the next day, many shorts will have a strong incentive to cover their short positions.
Important factors:- The Bullish Dragonfly Doji pattern is a stronger bullish signal and is more reliable than a Bullish Hammer Pattern. However, a confirmation of the trend reversal implied by this pattern by either a white candlestick, a large gap up or a higher close on the next trading day is still suggested, to be on the safe side.
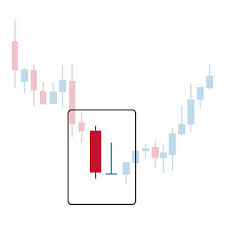
- Market is characterised by a downtrend.
- We see a black body formed at the lower end of the trading range.
- We then see a Doji, which does not have a lower shadow in the second day.
- No gap down is required.
Gravestone Doji: A Doji with opening and closing prices equal to the low of the day. The Bullish Gravestone Doji Pattern is a bottom reversal pattern. Similar to its cousin the Bullish Inverted Hammer Pattern, it occurs in a downtrend and represents a possible reversal of trend. The Bullish Gravestone Doji pattern forms when the open, low and close are equal and the high creates a long upper shadow. The Gravestone Doji indicates that buyers dominated trading and drove prices higher during the session. However, by the end of the session, sellers resurfaced and pushed prices back to the opening level and the session low. As with the dragon fly Doji and other candlesticks, the reversal implications of gravestone Doji depend on previous price action and future confirmation. Even though the long upper shadow indicates a failed rally, the intraday high provides evidence of some buying pressure. After a long downtrend, long black candlestick, or at support, focus turns to the evidence of buying pressure and a potential bullish reversal. After a long uptrend, long white candlestick or at resistance, focus turns to the failed rally and a potential bearish reversal.
Explanation: The market opens below the closing price of the previous day. Then there is a brief rally but the rally is not enough to send prices above the closing price of previous day and prices then reverse direction and fall down to the day’s lows. This movement, however, leaves shorts in a losing position creating the potential for an upcoming rally. It may not be clear why it signals a potential reversal. The answer has to do with what happens over the next session. If the next day opens above the real body of the Gravestone Doji, it means those who shorted at the opening (or closing) of the Gravestone day are losing money. The longer the market holds above the Gravestone Doji’s real body; the more likely these shorts will cover their positions. The shorts will then spark a rally, which also encourages the bottom pickers to go long. The Gravestone Doji pattern represents the graves of those bears or shorts that have died defending their territory.
Important factors:- The Bullish Gravestone Doji pattern requires further confirmation on the next day.
- Confirmation may be in the form of the next day opening above the Gravestone Doji’s body.
- The larger the gap the stronger the confirmation will be.
- A white candlestick with higher prices can also be another form of confirmation.
- Market is characterised by a bearish mood and downtrend.
- Then we see a Doji that gaps in the direction of the downtrend.
- The real body is either a horizontal line or it is significantly small.
- Both of the upper and lower shadows are long and they are almost equal in length.
Long-Legged Doji pattern: The Long-Legged Doji pattern is a Doji characterised with very long shadows. It shows the indecision of the buyers and sellers. It is one of the important reversal signals.
Explanation: The Long-Legged Doji pattern shows that there is a great deal of confusion and indecision in the market. This particular pattern shows that the prices moved well above and below the day's opening levels, however they finally closed virtually at the same level with the opening price. The end result is only a little change from the opening price, showing little change from the initial open, despite the whole volatility and excitement during the day that clearly reflects that the market lost its sense of direction.
Important factors:- The Long-Legged Doji pattern is more important at market tops. Long Legged Doji is a single candlestick pattern. It requires confirmation in the form of a move opposite to the prior trade on the next trading day.
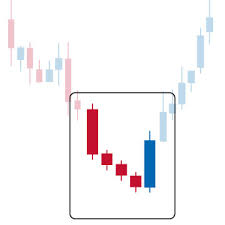
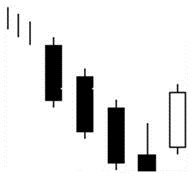
- Market is characterised by a downtrend.
- We see a long black candlestick on the first day.
- Then we see a black candlestick on the second day with a gap below the first day.
- The bearish mood continues on the third and fourth days as evidenced by lower consecutive closes.
- Finally, we see a long white candlestick on the fifth day characterised by a closing price inside the gap caused by the first and second days.
Breakaway: The Bullish Breakaway pattern consists of five candlesticks. There is a downtrend but we also see that the prices bottom out and level off now. A long black day is followed by a black day that gaps below the first day. The next two days continue in the same direction with lower consecutive closes. The final day is a long white day that does not close the initial downward gap of the first and second days. This suggests a short-term reversal.
Explanation: The Bullish Breakaway pattern appears during a downtrend and it shows that selling accelerated to the point of an oversold market. In a downtrend or within a pullback of an uptrend, the share exhausts itself with a gap down, but although the downward movement continues, it slows noticeably. The long white day suggests a possible reversal in the making to at least fill the overhead gap. Declining volume on the three middle days with a pickup in volume on the white day, serves as confirmation. It starts with a long black day then involves a gap in the direction of the downtrend followed by three consecutively lower price days. So far, all days in this pattern are black with the exception of the third day, which can be either be black or white. The three days after the gap are similar to the Three Black Crows pattern since their highs and lows are each consecutively lower. It is by now apparent that the downtrend has accelerated with a big gap and then starts to fizzle, however it still continues. There is an evident slow deterioration of the downtrend suggested by this pattern. Finally, we see a burst in the opposite direction, which completely recovers the previous three days' price action. The gap is not filled which points out to the weakness of the reversal. This is a short-term reversal.
Important factors:- A confirmation on the sixth day is recommended in the form of a white candlestick, a large gap up or a higher close, to be sure about the reversal.
- Market is characterised by a downtrend.
- Then we see a small black body.
- The next day we see a white body that completely engulfs the black real body of the preceding day.
Bullish Engulfing pattern: The Bullish Engulfing pattern is a pattern characterised by a large white real body engulfing a preceding small black real body, which appears during a downtrend. The white body does not necessarily engulf the shadows of the black body but totally engulfs the body itself. The market should be in a definable trend, not chopping around sideways. The shadows of the prior candlestick do not need to be engulfed. The Bullish Engulfing Pattern is an important bottom reversal signal.
Explanation: While the market sentiment is bearish; we see some subsided selling reflected by the short, black real body of the first day. The next day shows bull strength with a closing price at or above the previous day’s open. It means that the downtrend is now losing momentum and the bulls are starting to take the lead.
Important factors:- The relative size of the bodies in the first and second days is important. If the first day of the Bullish Engulfing pattern is characterised by a very small real body (it may even be a Doji or nearly a Doji) but the second day is characterised by a very long real body, this strongly indicates that the bearish power is diminishing and the disparity of white versus black body is indicative of the emerging bull power.
- There is higher probability of a bullish reversal if there is heavy volume on the second real body or if the second day of the Bullish Engulfing Pattern engulfs more than one real body (which essentially means we see two or more small black bodies preceding the long white body). If not much volume occurs on the first day of the Bullish Engulfing pattern compared to the second day, then this increases the strength of the pattern. The second day opens below the close of the first day, however quickly rallies to close above the open of the first day. This damages the spirits of the shorts and brings into question the bear trend which prompts additional buying in the coming days.
- The reversal of downtrend needs further confirmation on the third day. This confirmation may be in the form of a white candlestick, a large gap up or a higher close on the third day.
- Market is characterised by a downtrend.
- Then we see a long black candlestick.
- Long black candlestick is followed by a Doji completely engulfed by the real body of the first day. The shadows (high/low) of the Doji may not be necessarily contained within the first black body, though it is preferable if they are.
Bullish Harami Cross: The Bullish Harami Cross pattern is a Doji preceded by a long black real body. The Bullish Harami Cross pattern is a major bullish reversal pattern. It is more significant than a regular Bullish Harami pattern.
Explanation: The Bullish Harami Cross pattern is a strong signal of disparity about the market’s health. During a downtrend, the heavy selling reflected by a long, black real body; is followed by a Doji the next day. The Bullish Harami Cross pattern shows that the market is starting to severe itself from the prior downtrend. The second day's price range does not pierce the previous day's range and closes about where it opened. Volume on the second day is low which indicates that traders are lacking enough information to decide whether to go long or short.
Important factors:- The Bullish Harami pattern is not a major reversal pattern but the Bullish Harami Cross pattern is a major upside reversal pattern. Short traders will not be wise to ignore the significance of a Harami Cross just after a long black candlestick. Harami Crosses point out to the bottoms.
- A third day confirmation of the reversal is recommended (though not required) to judge that the downtrend has reversed. The confirmation may be in the form of a white candlestick, a large gap up or a higher close on the next trading day.
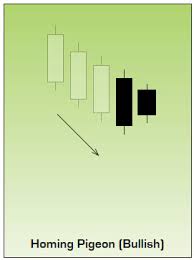
- Market is in a downtrend.
- We see a black body on the first day.
- Then we again see a black body on the second day where the real body of this second day is completely engulfed by the real body of the first day. It is not required that the shadows (high/low) of the second candlestick are contained within the first, though it is preferable if they are.
Bullish Homing Pigeon pattern: The Bullish Homing Pigeon pattern is a relatively long black real body that is followed by small black real body, which gaps opposite to the trend and is completely engulfed by the real body of the first day.
Explanation: The Bullish Homing Pigeon pattern is a signal of disparity. In a downtrend or within a pullback of an uptrend, we first see heavy selling reflected by the long, black real body of the first day. The next day’s gap up comes as a surprise to the shorts who thought they were sitting on a great position the previous day, but the share gives up some of its gap up back causing the candle to be filled in. This relaxes the bears and worries the bulls, and this is the exact recipe needed for a possible bounce. This points out to diminished power and enthusiasm of the sellers, thus suggesting a trend reversal. Confirmation is needed with a strong following day on solid volume.
Important factors:- The important fact about this pattern is the requirement that the second day has a minute real body relative to the prior candlestick and that this small body is completely contained by the larger one. The Bullish Homing Pigeon pattern is not necessarily a signal for a rally. The market usually has a tendency to enter into a congestion phase following a Homing Pigeon pattern
- The bullish Homing Pigeon pattern is similar to the Bullish Harami and the Bullish Matching Low patterns.
- We must check the third day to confirm that the downtrend has reversed. This confirmation may be in the form of a white candlestick, a large gap up or a higher close on the next trading day (on the third day).
- Market is characterised by a downtrend.
- We see three long black candlesticks characterised by consecutively lower opens and a closing sequence just like the Bearish Three Black Crows pattern.
- Then we see a black candlestick on the fourth day with an upper shadow.
- Finally we see a white candlestick opening above the body of the fourth day on the fifth day.
Bullish Ladder Bottom: The Bullish Ladder Bottom pattern consists of five candlesticks. Three black days occur with successive lower opens and lower closes. Then a black day forms with some noticeable upper shadow. The final day is a white day that gaps against the trend and opens above the body of the fourth day. The shorts may have a chance to close their positions and realize that their profits by the fourth day of a considerable downtrend. Then we see an upward gap on the fifth day as a result of this. If the body of the fifth day is long, or the volume is high, this may also imply a bullish reversal.
Explanation: In a downtrend or during a pullback within an uptrend, the bears are certainly in control and are happy. Then we see a good move downward. Prices start trading above the opening price and almost reaching to the new high of the previous day, but then they close at another new low. The buying that takes place on the fourth day that forms the long upper shadow hints at buyers starting to bottom fish. This action is a warning for the shorts telling them that the market will not go down forever and the shorts may then be forced to reevaluate their positions and they start closing their positions on the next day if profits are good. The intraday sell-off that closes the share at the lows likely wipes out the bulls, and with the lack of sellers available, there is not much resistance left when the shorts start to cover. This act is the reason behind the upward gap we see on the last day of the pattern and also the close is considerably higher. If volume is high on the last day, a trend reversal has probably occurred.
Important factors:- The Bullish Ladder Bottom pattern is similar to the Bullish Concealing Baby Swallow pattern and the Bearish Three Black Crows pattern.
- A confirmation on the sixth day is suggested in the form a white candlestick, a large gap up or a higher close, to be sure that the market has reversed.
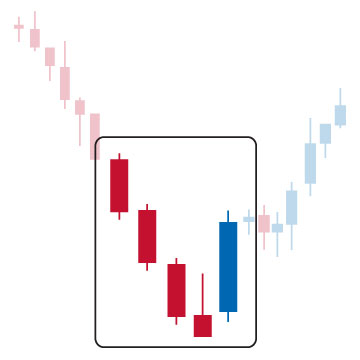
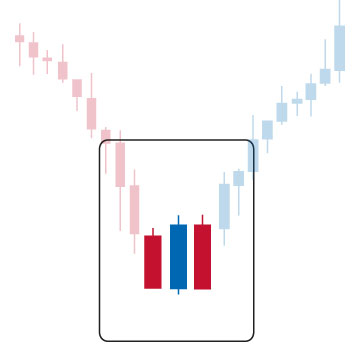
- The market moves in a downtrend.
- We then see a long black candlestick on the first day.
- Second day follows with another black candlestick whose closing price is equal or extremely close to the closing price of the first day.
Bullish Matching Low: The Bullish Matching Low pattern occurs when two black days appear with equal closes in a downtrend. The pattern is suggestive of a short-term support, and it may cause a reversal on the next day of trading.
Explanation:
The market continues to move lower, signaling that the bears are in control, as evidenced by the first black candlestick. The next day prices open at a higher level
by gapping up, they then continue to go up during the day but closes at the same level as the previous day. This pattern suggests a short-term support level.
The more times a share can successfully test and hold a low or support level, the higher the chance a reversal will occur once the sellers become exhausted.
Shorts should be aware of this fact. If they ignore the Bullish Matching Low pattern as a possible reversal signal, they may pay for it soon.
Two days closing at the same price is indicative of short-term support and this support may be followed by a reversal on the next day of trading.
Strength the following day with volume would confirm the pattern.
- The bullish Matching Low pattern is similar to the Bullish Homing Pigeon pattern.
- The reversal of downtrend requires a confirmation on the third day.
- The confirmation of the trend reversal may be in the form of a white candlestick, a large gap up or a higher close on the next trading day (on the third day).
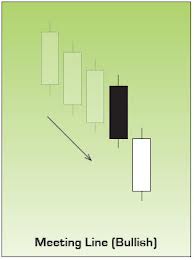
- Market is characterized by a downtrend.
- We see a black candlestick on the first day.
- Then we see a long white candlestick on the second day. Its body is lower than the previous trend.
- The closing prices are same or almost same on both days.
- Both candlesticks are long but the second candlestick may be shorter than the first.
Bullish Meeting Lines: The Bullish Meeting Lines pattern is a pattern that reflects a stalemate between the bulls and the bears. A long black day is followed by a long white day that gaps sharply lower when it opens in the direction of the trend but then rallies to close at the same price as the black day’s close.
Explanation: In a downtrend or during a pullback within an uptrend, a long black day occurs. The next day gaps down in the direction of the trend, causing the bears to feel confident and most likely the remaining bulls to throw in the towel. The share then rallies as bottom fishers step in or as the bulls start a counterattack pushing the prices up and the shorts to start covering their positions. The identical close of the two candles can be considered to be incidental and not extremely important. The fact remains that the bulls were washed out and now short covering may cause the share price to bounce as the downtrend has now been breached.
Important factors:- The Bullish Meeting Lines pattern is similar to the Bullish Piercing Line pattern, the Bearish In Neck pattern, the Bearish On Neck pattern, and the Bearish Thrusting pattern.
- The Bullish Meeting Lines pattern is a pattern that is comparable to the Bullish Piercing Line pattern. The Piercing Line pattern has the same two-candlestick pattern. The main difference between the two is the fact that the bullish counterattack does not carry the prices up to the prior session’s white real body in the case of the Bullish Meeting Lines pattern. It can only get back to prior session’s close while the Piercing Line pattern’s second line pushes well into the black real body. Consequently the Piercing Line pattern is a more significant bottom reversal pattern. Nonetheless, the Bullish Meeting Lines pattern should also be respected.
- The Bullish Meeting Lines pattern requires confirmation of the reversal on the third day. This confirmation may be in the form of a white candlestick, a large gap up or a higher close on the third day.
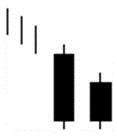
- Market is characterized by downtrend.
- We see a Black Closing Marubozu on the first day.
- Then we see a white candlestick, which is above the close of the first day.
- Then we again see a Black Closing Marubozu characterised with a close equal to the close of the first day.
Bullish Stick Sandwich: The Bullish Stick Sandwich pattern is characterised by a black day that is followed by a white day that gaps against the downtrend and closes above the black day’s high. The third day is a black day whose close is equivalent to that of the first day. The pattern shows consecutive higher opens for three days, but results in an eventual close equal to the first day's close. It may warn that prices are now finding a support level. We may then see a reversal from this support level.
Explanation: In the Bullish Stick Sandwich pattern, there is a downtrend going on. Then prices open higher on the next trading day and they reach to higher levels all day, closing at or near the high. This bullish act suggests that the previous downtrend may now reverse implying that the shorts need protection. The next day, prices open at a higher level leading some shorts to cover their positions initially but then the prices start moving lower to close at the same price as two days ago. After two consecutive higher opens, the share price is right back where it started. One can sense that the share wants to move up, but it needs to solidify support first. As long as the support level holds a reversal is possible.
Important factors:- A confirmation on the fourth day is required to be sure that the downtrend is reversed. Confirmation may be in the form of a white candlestick, a large gap up or a higher close on the fourth day.
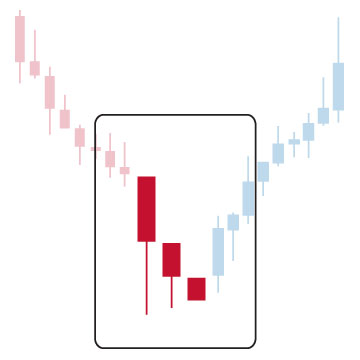
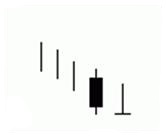
- Market is characterized by a downtrend.
- We see a long Black Opening Marubozu pattern on the first day characterized by a long lower shadow just like a Hammer pattern.
- We then see a Black Opening Marubozu pattern on the second day similar to the first day, however, smaller in body with a low above the first day’s low.
- We finally see a small Black Marubozu pattern on the third day that lies within the second day’s trading range.
Bullish Three Stars in the South: The Bullish Three Stars in the South pattern consists of three consecutive black candlesticks during a downtrend. A long black day with a long lower shadow is followed by a similar but smaller black day whose lower shadow is shallower than the first day. The third day is a small Black Marubozu pattern (i.e. the open is the high of the day and the close is the low of the day) that lies within the second days trading range.
Explanation: The Bullish Three Stars in the South pattern is a bottoming pattern that shows a slowly deteriorating downtrend, which is characterised by each of the successive black candles slightly less bearish than the previous one, so the trend is slowly weakening. Buying enthusiasm is reflected by the long lower shadow of the first day. The next day opens at a higher level, trades lower, but its low is not lower than the previous day's low. This second day also closes off its low. Then we see a black Marubozu pattern, which is engulfed by the previous day's range on the third day. Higher lows cause uneasiness among the shorts. The last day of the pattern reflects market indecision, with hardly any price movement. The shorts are now ready to cover their positions if they see anything on the upside. Everything points out that the tide is slowly turning toward the bullish side. As long as the low of the first candle is held, and a white candle on volume can form soon after, a reversal may be in the works.
Important factors:- The Bullish Three Stars in the South pattern is similar to the Bearish Three Black Crows pattern
- A confirmation on fourth day is required to be sure that the downtrend has reversed. This confirmation may be in the form of a white candlestick, a large gap up or a higher close on the fourth day.
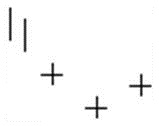
- Market is characterised by a downtrend.
- Then we see three consecutive Doji.
- The second day Doji gaps below the first and third.
Bullish Tri Star: The Bullish Tri Star pattern is a very rare but significant bottom reversal pattern. Dojis occur on three consecutive trading days with the second being a Doji Star that gaps lower and the third Doji gapping back up.
Explanation: In a downtrend or during a pullback within an uptrend, a battle begins. In the case of a Bullish Tri Star Pattern, we have a market that has been in a downtrend for a long time. The bears start to back off while the bulls step up. The weakening trend shows itself by the fact that the real bodies are probably becoming smaller. Dojis indicate an even battle between the bulls and bears. The formation of three Dojis within a downtrend hints that the bulls may be starting to reassert themselves. The first Doji is a matter of concern. The second Doji clearly indicates that market is losing its direction, while the third Doji warns that the downtrend is over. This pattern indicates too much indecision leading to a reversal of positions. A white day with volume is needed to confirm the reversal.
Important factors:- A confirmation on fourth day is required to be sure that the downtrend has reversed.
- Confirmation may be in the form of a white candlestick, a large gap up or a higher close on the fourth day.

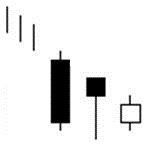
- Market is characterized by a downtrend.
- We see a long black candlestick on the first day.
- Then we see a Hammer-like black candlestick on the second day.
- The lower shadow of the second day sets a new low.
- Then we see a short white candlestick, which is below the second day’s candlestick.
Unique Three River Bottom pattern: The Bullish Unique Three River Bottom pattern is an extremely rare bottom reversal pattern. Its first candlestick is an extended black candlestick followed by a Homing Pigeon pattern (a black real body closing higher than the first candlestick’s close) whose lower shadow makes a new low, and the third candlestick is a white candlestick with a very small real body that closes below the second day’s close.
Explanation: In a downtrend or during a pullback within an uptrend, a black day occurs. The next day opens at a higher level, however, bearish sentiment is strong causing a new low during the day. The day closes near the high, thus producing a small black body within the body of the first day. This second black day has a long lower black shadow which indicates the possibility of an intraday washout of the bulls. This rally questions the strength of bears. The increasing uncertainty is further strengthened when the third day opens lower but not as low as the low of the second day. There is some stability on the third day as evidenced by its small white body. Since the third day gaps lower, the bears are still thought to be somewhat in control, but the higher close (inability of the bears to push the share lower) suggests the bearish tone may be changing. The third day ends by a rally closing below the close of the second day. If price rises to new high on the fourth day, then a reversal of trend is confirmed.
Important factors:- A confirmation on fourth day is advisable to show that the downtrend has reversed. This may be in the form of a white candlestick, a large gap up or a higher close on the fourth day.
Belt Hold
Hammer
Harami
Inverted Hammer
- There must be an overall downtrend in the market.
- The day gaps down, and the market opens at its low but then prices go up during the day and they close near to the days high.
- We see a white body that has no lower shadow that is a White Opening Marubozu.
Bullish Belt Hold: The Bullish Belt Hold pattern is also single candlestick pattern. It is basically a White Opening Marubozu that occurs in a downtrend. As such; it opens on its low, then we see a rally during the day against the overall trend of the market, and then the day closes near its high but not necessarily at its high. If Belt Hold lines are characterized by longer bodies, then it means that they offer more resistance to the trend they are countering.
Explanation: The market starts the day with a significant gap in the direction of prevailing downtrend. So the first impression reflected in the opening price is continuation of the downtrend. The remaining price action for the day occurs to the upside. This triggers a buying spree. However; then things change rapidly and the price action of the day is the opposite to the previous trend. This obviously causes much concern among some shorts, which cover their positions due to concern over this price action. This accentuates the reversal and it may signify a rally for the bulls.
- The market is characterised by a prevailing downtrend.
- Then we see a small real body at the upper end of the trading range. Colour of this body is not important.
- We would like to see the lower shadow at least twice as long as the real body.
- There is no (or almost no) upper shadow.
Bullish Hammer: The Bullish Hammer pattern is a significant candlestick that occurs at the bottom of a trend or during a downtrend and it is called a hammer since it is hammering out a bottom. The Bullish Hammer pattern is a single candlestick pattern and it has a strong similarity to the Bullish Dragonfly Doji pattern. In the case of Bullish Dragonfly Doji pattern, the opening and closing prices are identical, whereas the Bullish Hammer pattern has a small real body at the upper end of the trading range.
Explanation: The overall direction of the market is bearish, characterised by a downtrend. Then the market opens with a sharp sell-off implying the continuation of the downtrend. However, prices suddenly turn upwards, the sell-off is quickly abated and bullish sentiment continues during the day with a closing price at or near to its high for the day which causes the long lower shadow. Apparently the market fails to continue in the selling side. This observation reduces the previous bearish sentiment causing the short traders to feel increasingly uneasier with their bearish positions. As with any single candlestick pattern, confirmation is required. The Bullish Hammer pattern shows that the price goes much lower than the open then closes near the opening price. This fact reduces the confidence of the bears. Ideally, a white real body Hammer with a higher open the following day could be a bullish signal for the days ahead.
Important factors:- If the Hammer is characterised by a close above the open, thus causing a white body, the situation looks even better for the bulls.
- The Bullish Dragonfly Doji pattern is generally considered more bullish than the Bullish Hammer pattern and a higher reliability is ascribed to this Doji than the Bullish Hammer pattern.
- The reliability of Bullish Hammer pattern is low. It requires confirmation of the implied trend reversal by a white candlestick, a large gap up or a higher close on the next trading day.
- The market is in a bearish mood characterized by a downtrend.
- Then we see a long black candlestick.
- We see a white candlestick on the following day where the small white real body is completely engulfed by the real body of the first day. The shadows (high/low) of the second candlestick are not necessarily contained within the first body, however, it is preferable if they are.
Bullish Harami pattern: The Bullish Harami pattern is characterised by a small white real body contained within a prior relatively long black real body. Harami is an old Japanese word for pregnant. The long black candlestick is the mother and the small candlestick is -the baby-.
Explanation: The Bullish Harami pattern is a sign of disparity about the market’s health. A long first day with high volume in the existing downtrend brings complacency to the bears. While the market is characterised by downtrend and bearish mood; there is heavy selling reflected by a long, black real body. However, this is followed by a small white body in the next day as the next day trades in a small range within the previous day's real body. This may signal a trend reversal since the second day’s small real body shows that the bearish power is diminishing. Light volume on the second day should give rise to concern by the bears of an impending change of trend. Look for higher prices over the coming days, especially if the next day provides confirmation of a trend change by closing higher.
Important factors:- The decisive fact about this pattern is that the second candlestick has a minute real body relative to the prior candlestick. Furthermore this small body is completely inside the larger one. The Bullish Harami Pattern does not necessarily imply that a rally will follow. Market usually enters into a congestion phase following the Bullish Harami.
- We may need a third day confirmation to be sure that the downtrend has really reversed. This confirmation of the trend reversal may be signaled by a white candlestick, a large gap up or by a higher close on the third day.
- Market is currently characterised by a downtrend.
- The first day of the pattern is a black candlestick formed at the lower end of the trading range.
- The second day of the pattern is a small real body and is formed at the lower end of the trading range.
- The colour of the second real body is not important, however the colour of the body is black in the first day.
- No gap down is required, as long as the pattern is seen after a downtrend.
- Upper shadow of the second small body should be at least twice as long as the real body.
- The second body does not have lower shadow or it has only a very little lower shadow.
Bullish Inverted Hammer: The Bullish Inverted Hammer pattern is a candlestick characterised by a long upper shadow and a small real body preceded by a long black real body. It is similar in shape to the Bearish Shooting Star. The shooting star appears in a downtrend and thus it becomes a potentially bullish inverted hammer.
Explanation: The Bullish Inverted Hammer pattern occurs in a bearish background. In a day of inverted hammer, market opens at or near its low. Then prices change direction and we see a rally. However the bulls cannot succeed to sustain the rally during the rest of the day and prices finally close either at or near the low of the day. It may not be clear why this type of price action is interpreted as a potential reversal signal. The answer has to do with what happens over the next day. If the next day opens above the real body of the inverted hammer, it means that those who shorted at the opening or closing of the inverted hammer day are losing money. The long upper shadow and small real body at the bottom of the trading range are cause for concern for the bears. They wonder if this is the end of the downtrend and take measures to protect their gains. If the next day opens above the body of the Inverted Hammer, then expectations could be for shorts to cover and propel a reversal rally. The longer the market holds above the inverted hammer’s real body, the more likely these shorts will attempt to cover their positions. This may ignite a rally as a result of covered short positions, which may then inspire the bottom pickers to take long positions.
Important factors:- Bullish verification on the day following the inverted hammer is required. This verification can be in the form of the next day opening above the inverted hammer’s real body. The larger the gap the stronger the confirmation will be. A white candlestick with higher prices can also be another form of confirmation.
Mat hold pattern
Rising three methods
Side-by-side white lines
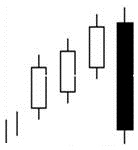
- Market is characterised by an uptrend.
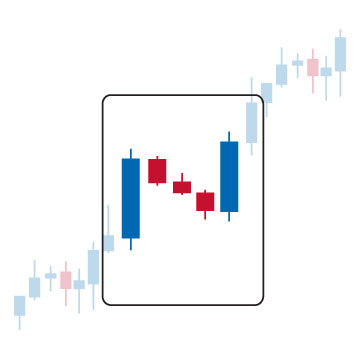
- We see a long white candlestick in the first day.
- We then see an upward gap and a black candlestick on the second day.
- We see a sequence of small real bodies constituting a brief downtrend but it stays within the range of the first day on the second, third, and fourth days.
- Finally we see a white candlestick, which opens with a gap and closes with a new high on the fifth day. The fifth day simply continues the trend.
Bullish Mat Hold pattern: The Bullish Mat Hold pattern is known as a strong continuation pattern. In this pattern, a long white candlestick appears during an uptrend, which then is followed by three consecutive small real bodies that constitute a short downtrend. Then bull ascendancy begins on the fifth day marked with a closing price that is a new high.
Explanation: The pattern appears during an uptrend, which is further confirmed by the first long white candlestick. Prices open with a gap the next day and they trade within a narrow range, closing at a slightly lower level, briefly pulling back (preferably on light volume). This may be a lower close but it is still a new closing high along the uptrend. This suggests that the bulls now prefer to rest while the bears are encouraged. The next couple of days start causing some concern about the ability of the upward move to sustain itself since these days open at the level where the market closed on the previous day and they close at slightly lower levels. In any case, the markets are still higher than the opening price of the first day even on the third day, and remember that the first day was a long white candlestick day. This observation shows that there was an attempt for reversal but it failed. Prices rise again to close at a new closing high apparently showing that the events of past few days were only a pause in a strong upward trend. The fifth day simply continues the trend. It appears that attempts to reverse the trend occurred, but failed. The upward trend should continue. The brief pullback was nothing more than a few days off for the bulls.
Important factors:- he Bullish Mat Hold pattern is similar to the Bullish Rising Three Methods pattern. The difference is that the reaction days, two, three, and four are altogether higher than those in the Bullish Rising Three Methods Pattern.
- The reliability of this pattern is very high, but still a confirmation in the form of a white candlestick with a higher close or a gap-up is suggested.
- Market is characterised by an uptrend.
- We see a long white candlestick on the first day.
- Then we see small real bodies defining a brief downtrend but staying within the range of the first day on the second, third and fourth days.
- Finally we see a long white candlestick on the fifth day opening above the close of the previous day and also closing at a new high. The fifth day simply continues the trend.
Rising Three Methods pattern: The Bullish Rising Three Methods pattern is a bullish continuation pattern representing a pause during a trend without causing a reversal. The Bullish Rising Three Methods is similar to the bullish Mat Hold pattern. The pattern is characterised by a long white candlestick followed by three small bodies in three consecutive days. The small bodies represent some resistance to previous uptrend and they may even trace a short downtrend. These three reaction days usually have black candlesticks but the bodies remain within the high and low range of the first day's white candlestick. The pattern is completed by a white candlestick on the fifth day, opening above the close of the previous day and closing at a new high. The small downtrend between the two long white candlesticks represents a break during the uptrend. The upward trend then resumes and continues.
Explanation: The Bullish Rising Three Methods pattern typically represents a rest in the market action, or a brief pullback (preferably on light volume). This may be used to add new positions by longs. The pattern is the reflection of doubts about the ability of the trend to continue. This doubt may increase because of small-range reaction days. However, given the fact that a new low cannot be made, the bullishness is resumed and new highs are set quickly. The brief pullback is nothing more than a few days off for the bulls.
Important factors:- The high-low range includes the shadows.
- The reliability of the Bullish Rising Three Methods pattern is very high, but a confirmation in the form of a white candlestick with a higher close or a gap-up still is suggested. Remember, that these particular candlestick patterns are rare.
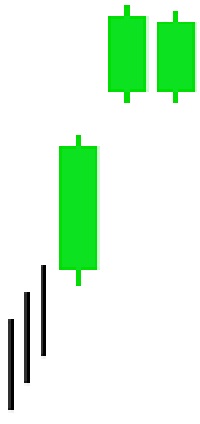
- Market is characterised by an uptrend.
- We see a white candlestick in the first day.
- Then we see another white candlestick on the second day with an upward gap.
- Finally, we see a white candlestick on the third day characterised by the same body length and whose closing price is equal to the close of the second day and a new high is established.
Side-By-Side White Lines pattern: The Bullish Side-By-Side White Lines pattern consists of three candlesticks. A white candlestick with an upward gap over another white candlestick is followed in the next day by another similar sized white candlestick. The second and the third days have the same opening price.
Explanation: The Bullish Side By Side White Lines pattern appears in a bullish market. The first white candlestick confirms the continuation of the bull market. In an uptrend the second white candle that gaps up could signify the last of the bulls getting in “at any price.” On the second day, the market opens with an upward gap and it closes at a still higher level. The gap down the next day could be the start of a pullback, but since the share rallies again, the bulls obviously are not done yet. On the third day, the market suddenly opens at a much lower level even as low as the previous day's open. However, the initial selling that causes the lower opening ends quickly and the market again climbs to yet another high. As a continuation pattern, this formation hints at more upside to come and demonstrates that the bullish move is continuing.
Important factors:- The two side-by-side white candlesticks that we see after the upward gap are not only of similar size, but also their opening prices should be almost the same.
- The reliability of the Bullish Side By Side White Lines pattern is very high, but still a confirmation in the form of a white candlestick with a higher close or a gap-up is suggested.
Upside Gap 3 Methods
Upside Tasuki Gap
- Market is characterised by an uptrend.
- We see two long white candlesticks with a gap between them.
- Then we see the black candlestick on the third day, which opens within the body of the second day.
- The third black candlestick fills the gap between the first two days.
Bullish Upside Gap Three Methods: The Bullish Upside Gap Three Methods pattern is characterized by two long white candlesticks with a gap upward between them during an uptrend. The third day is a black candlestick, which closes the gap between the first two. A support for uptrend may be forming caused by temporary profit taking.
Explanation: With the Bullish Upside Gap Three Methods pattern, the market is in a strong bullish mood. The bullish move goes on further by another day that gaps in the direction of the uptrend. However, the third day opens well into the body of the second day filling the gap. The gap-closing move may be interpreted as supporting the current uptrend. Gaps create excellent support and/or resistance points, which become evident after a reasonable period of time. The gap here is filled within one day suggesting other considerations. If this is the first gap of a move, then the third day action, also called reaction day, can be considered as profit taking. It is usually defined as a closing gap movement in technical analysis. As long as the white candles have higher volume than the black, the one black profit taking day should not be a big concern. The uptrend should continue if indeed the share is strong.
Important factors:- This Bullish Upside Gap Three Methods pattern is a simple pattern similar to the Bullish Upside Tasuki Gap pattern (discussed next). However, the Bullish Upside Tasuki Gap pattern is characterised by a gap in the first two days and it is not filled on the third day.
- A confirmation on fourth day is required in the form of a white candlestick, a large gap up or higher close.
- Market is characterised by an uptrend.
- We see two long white candlesticks with a gap between them.
- Then we see black candlestick on the third day that opens within the body of the second day.
- The third day candlestick closes into the gap but does not fully close the gap.
Bullish Upside Tasuki Gap: The Bullish Upside Tasuki Gap pattern is characterised by two long white candlesticks with a gap upward between them during an uptrend. However, the pattern also shows a black candlestick on the third day partially closing the gap between the first two. The black candlestick is the result of temporary profit taking. We expect the trend to continue upward following the direction of the upward gap.
Explanation: The Bullish Upside Tasuki Gap pattern appears in a strongly upward market. This bullish move continues one more day with a gap in the direction of the uptrend. The black candlestick of the third day is characterized by an opening well into the body of the second day, which partially fills the gap. This third day, called the correction day, do not completely fill the gap so the previous uptrend should continue. This is a case of temporary profit taking. Since the gap a gap is partially filled, this is simply a profit taking scenario. We have a strong share in an uptrend that pulls back. As long as the black day is on lighter volume, the bulls will most likely retake control soon after and the previous upward trend must continue.
Important factors:- This Bullish Upside Tasuki Gap pattern is a rare formation.
- The real bodies of the last two candlesticks in the Bullish Upside Tasuki Gap pattern are about the same size.
- This Bullish Upside Tasuki Gap pattern is a simple pattern quite similar to the Bullish Upside Gap Three Methods pattern. The only difference is that in the Bullish Upside Gap Three Methods pattern, the gap that is made between the first two days is filled on the third day.
- A confirmation on the fourth day is recommended in the form of a white candlestick, a large gap up or a higher close.
Separating Lines
Bullish 3 Line Strike
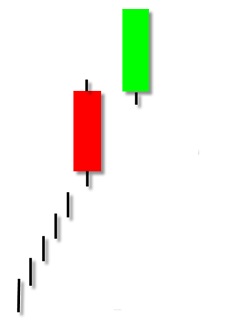
- Market is characterised by an uptrend.
- We see a long black candlestick in the first day.
- Then we see that the second day has the same opening price as the first day, or extremely close to it.
- &The second day pattern is a White Opening Marubozu.
Separating Lines: The Separating Lines pattern is simply a black day followed by a white day (White Opening Marubozu) that has the same opening price. During an uptrend, after we see a black candlestick in the first day, the market gaps up sharply higher when it opens with an opening price equal to the prior session’s opening and it also closes the day at a higher level.
Explanation: In an uptrend, the underlying issue gaps up and falls to produce a black real body (especially a relatively long one), which is a matter of concern for longs as it may indicate that the bears may be gaining control. However, if the next day opens with a gap such that the second day opening price is equal to the previous black day’s opening price, it shows that the bears lost control of the market. If this white candlestick also closes at a higher level, it tells us the bulls have regained control and the uptrend will continue. This proves to be simple profit taking within the uptrend when the issue gaps up the next day and rallies to close near its high. In an uptrend, the Bullish Separating Lines pattern has low reliability, while the pattern is similar to the Bullish Kicking pattern.
Important factors:- The second pattern must be a White Opening Marubozu.
- A third day confirmation is required to be sure that the rally continues. This confirmation may be in the form of a white candlestick, a large gap up or a higher close on the next trading day (on the third day).
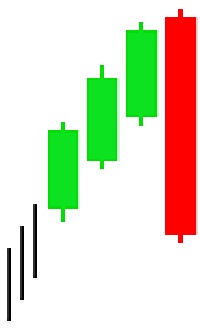
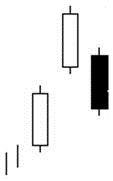
- Market is characterised by an uptrend.
- We see three consecutive long white candlesticks with consecutively higher closes.
- Then we see a black candlestick opening at a higher level and closing below the open of the pattern’s first day.
Bullish Three Line Strike: The Bullish Three Line Strike pattern is formed by three white long candlesticks with consecutively higher closes followed by a black candlestick on the fourth day that drives prices back to the point where they were at the beginning of the pattern. In an uptrend the Three Line Strike pattern has low reliability. The large black day can really scare the bulls and many contrarians will cite this as bullish. If indeed the uptrend was in a strong bullish trend before the pattern, then the one black day should not ruin the pattern. Hence, if the next day is up, the uptrend should continue higher. The Bullish Three Line Strike pattern is a possible continuation of the bullish Three White Soldiers pattern.
Explanation: The Bullish Three Line Strike pattern appears in a market characteristically in uptrend as evident in the three white candlesticks. The fourth day opens in the direction of the trend, however it then moves in opposite direction due to profit taking. There may be a reevaluation of the market direction now. However, we know that this move completely eradicated the gains of the previous three days. If the previous trend was really strong, this may now be interpreted as a temporary setback caused by profit taking. The last day of the pattern shows liquidating which may now give the upward trend a new strength to continue in the previous upward direction.
Important factors:- A confirmation on the fifth day in the form a white candlestick, a large gap up or a higher close is definitely required.
Abandoned baby
Dark Cloud Cover
Evening Doji Star
Evening Star
Reversal Kicking
3 Black Crows
3 Inside-Down
3 Outside-Down
Upside Gap 2 Crows
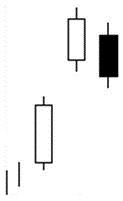
- Market is characterised by an uptrend.
- It is basically a long white day followed by a Doji that gaps in the direction
- Then we see a Doji on the second day whose shadows characteristically gap above the previous day's upper shadow and also gaps in the direction of the previous uptrend.
- Finally we see a black candlestick characterised with a gap in the opposite direction, with no overlapping shadows.
Bearish Abandoned Baby: The Bearish Abandoned Baby pattern is a very rare top reversal signal. It is basically a long white day followed by a Doji that gaps in the direction of the trend. Then a black day occurs gapping in the opposite direction with no overlapping shadows.
Explanation: Most of the three-day star patterns have similar scenarios. In an uptrend or within a bounce of a downtrend, the market seems still strong displaying a long white candlestick and opening with a gap on the second day but does not continue with it's upward movement. The trading on second day is within a small range and its closing price is equal or very near to its opening price. Now there is a sign of sell-off potential with reversal of positions with enough bears stepping in to bring supply and demand back into equilibrium and the share price churns in place. This is not necessarily bearish, but it is certainly less bullish. The trend reversal is confirmed by the black candlestick on the third day. A downward gap also supports the reversal.
Important factors:- The Bearish Abandoned Baby pattern does not occur too often and is similar to the Bearish Doji Star, Bearish Evening Star, and Bearish Evening Doji Star.
- The reliability of the Bearish Abandoned Baby pattern is very high,but still a confirmation in the form of a black candlestick with a lower close or a gap-down is suggested.
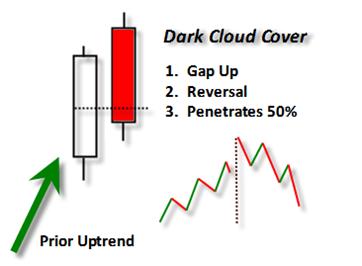
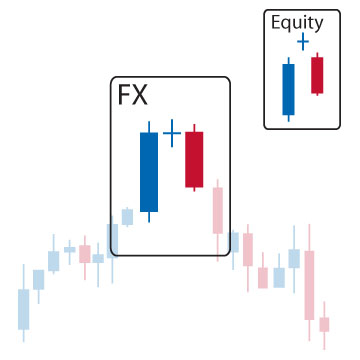
- Market is characterized by an uptrend.
- We see a long white candlestick in the first day.
- Then we see a black body characterized by an open above the high of the previous day on the second day.
- The second black candlestick closes within and below the midpoint of the previous white body.
Bearish Dark Cloud Cover: The Bearish Dark Cloud Cover pattern is a two-candlestick pattern signaling a top reversal after an uptrend or, at times, at the top of a congestion band. We see a strong white real body in the first day. The second day opens strongly above the previous day high (it is above the top of the upper shadow). However, market closes near the low of the day and well within the prior day’s white body at the end of the day.
Explanation: In an uptrend or within a bounce of a downtrend, we see a strong white candlestick suggesting that bulls retain the control. However, the rally does not continue as this is followed by a gap as we encounter sellers who push the share price back down. The market suddenly closes at or near the lows of the day so the second day body moving well into the prior day’s real body. This simply signifies the possibility of a reversal that is more reliable if the gap up occurs at resistance and the black day is accompanied by a surge in volume. Longs are shaken somehow and short sellers now have a benchmark to place a stop, which is at the new high of the second day.
Important factors:- If the black real body’s close penetrates deeper into the prior white real body, the chance for a top increases. Some Japanese technicians require more than a 50% penetration of the black day’s close into the white real body.
- If the black candlestick does not close below the halfway point of the white candlestick then it is better to wait for confirmation following the dark cloud cover; and even if it does, a confirmation may still be necessary. This confirmation may be in the form of a black candlestick, a large gap down or a lower close on the next trading day.
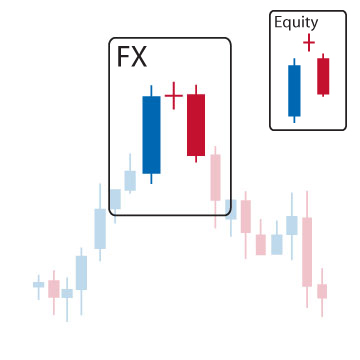
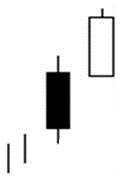
- Market is characterized by uptrend.
- We see a white candlestick in the first day.
- Then we see a Doji that gaps in the direction of the previous uptrend on the second day.
- Finally the third day is a black candlestick.
Bearish Evening Doji Star: The Bearish Evening Doji Star pattern is a major top reversal pattern formed by three candlesticks. The first candlestick is a long white body; the second is a Doji characterized by a higher gap thus forming a Doji star. The third one is a black candlestick with a closing price, which is within the first day’s white real body. It is a meaningful top pattern.
Explanation: The first white body, while the market is in an uptrend, shows the continuing bullish nature of the market. Then a Doji appears showing the diminishing power of the longs. The strong black real body on the third day proves that bears have taken over. An ideal Bearish Evening Doji Star pattern has a gap before and after the middle real body. The second gap is rare, but lack of it does not take away from the power of this formation.
Important factors:- The Doji may be more than one, two or even three.
- Doji’s gaps are not important.
- The Bearish Evening Doji Star is similar to the Bearish Doji Star, Bearish Evening Star, and Bearish Abandoned Baby patterns.
- The reliability of this pattern is very high, but still a confirmation in the form of a black candlestick with a lower close or a gap-down is suggested.
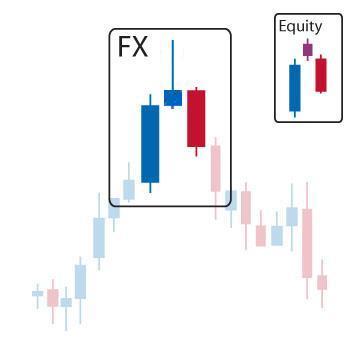
- Market is characterised by an uptrend.
- We see a long white candlestick in the first day. Then we see a small candlestick on the second day with a gap in the direction of the previous uptrend.
- Finally we see a black candlestick on the third day.
Bearish Evening Star:
The Bearish Evening Star pattern is a major top reversal pattern formed by
three candlesticks. The first candlestick is a long white body;
the second one is a small real body that may be white.
It is characteristically marked with a gap in higher direction thus forming a star.
In fact, the first two candlesticks form a basic star pattern.
Finally we see the black candlestick with a closing price well within the first session’s
white real body. This pattern clearly shows that the market has now turned bearish.
A candlestick that gaps away from the previous candlestick is said to be in star position. A Star appears when a small body gaps ABOVE the previous day's long body.
Stars are part of more complicated candlestick patterns,
especially the reversal patterns.
Explanation: The market is already in an uptrend when the white body appears which further suggests the bullish nature of the market. Then a small body appears showing the diminishing capacity of the longs. The strong black real body of the third day is a proof that the bears have taken over. An ideal Bearish Evening Star Pattern has a gap before and after the middle real body. The second gap is rare, but lack of it does not take away from the power of this formation.
Important factors:- The stars may be more than one, two or even three.
- The colour of the star and its gaps are not important.
- The Bearish Evening Star is similar to the Bearish Evening Doji Star, Bearish Abandoned Baby, Bearish Doji Star, Bearish Two Crows, and Bearish Upside Gap Two Crows patterns.
- The reliability of this pattern is very high, but still a confirmation in the form of a black candlestick with a lower close or a gap-down is suggested.
- Market direction is not important.
- We see a White Marubozu in the first day.
- Then we see Black Marubozu day that gaps downward on the second day.
Bearish Reversal Kicking: The Bearish Reversal Kicking pattern is a White Marubozu followed by a sharply lower gap when it opens during the second day. The second day opening is even below the prior session’s opening (forming a Black Marubozu). A big black candle that opens at its high and closes at the day's low is bearish regardless of the overall trend. Volume confirmation on the black day solidifies the pattern as is a follow up weak day. The Bearish Reversal Kicking pattern is similar to the Bearish Separating Lines pattern.
Explanation: The Bearish Kicking pattern sends a strong signal suggesting that the market is now heading downward. The previous market direction is not important in this pattern unlike most other candlestick patterns. The market has been in a trend when prices gap down the next day in the case of Bearish Kicking Pattern. The prices on the second day never enter into the previous day's range and we have a close with another gap.
Important factors:- Both of the candlesticks do not have shadows (or very small shadows if any). In other words both are Marubozu.
- The Bearish Kicking pattern is similar to the Bearish Separating Lines pattern except that instead of the open prices being equal, in the Bearish Kicking pattern a gap occurs.
- The Bearish Kicking pattern is highly reliable but still a confirmation may be necessary, and this confirmation may be in the form of a black candlestick, a large gap down or a lower close on the next trading day.
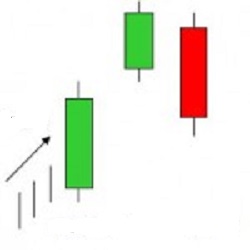
- Market is characterised by an uptrend.
- Three consecutive long black candlesticks appear.
- Each day closes at a new low.
- Each day opens within the body of the previous day.
- Each day closes near or at its lows.
Bearish Three Black Crows: The Bearish Three Black Crows pattern is indicative of a strong reversal during an uptrend or within a bounce of a downtrend, the three long black candles speak for themselves. It consists of three long black candlesticks, which look like a stair stepping downward. If volume accompanies the move, the reliability of the pattern increases significantly. The opening price of each day is higher than the previous day's closing price suggesting a move to a new short term low.
Explanation: The Bearish Three Black Crows pattern is indicative of the fact that the market has been at a high price for too long and the market may be approaching a top or is already at the top. A decisive downward move is reflected by the first black candlestick. The next two days show further decline in prices due to profit taking. The bullish mood of the market cannot be sustained anymore.
Important factors:- The opening prices of the second and third days can be anywhere within the previous day's body. However, it is better to see the opening prices below the middle of the previous day's body.
- If the black candlesticks are very extended, one should be cautious about an oversold market.
- The Bearish Three Black Crows is similar to the Bearish Identical Three Crows, Bullish Concealing Baby Swallow, Bullish Ladder Bottom and Bullish Three Stars in the South patterns and could be the beginning of the Bearish Three Line Strike pattern.
- The reliability of this pattern is very high, but still a confirmation in the form of a black candlestick with a lower close or a gap-down is suggested.
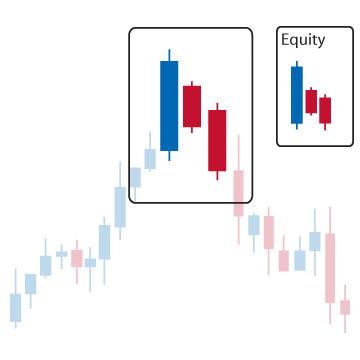
- Market is characterised by an uptrend.
- We see a Bearish Harami pattern in the first two days.
- We then see a black candlestick on the third day with a lower close than the second day.
Bearish Three Inside-Down: The Bearish Three Inside-Down pattern is another name for the Confirmed Bearish Harami pattern. The third day confirms the bearish trend reversal.
Explanation: In an uptrend or within a bounce of a downtrend, the first two days of this three-day pattern forms a Bearish Harami pattern. By itself this pattern has moderate reliability as a reversal pattern, but when followed by a weak day (preferably with a pick-up in volume) the overall pattern becomes much more reliable. The third day confirms the reversal suggested with the Bearish Harami pattern since it is a black candlestick closing with a new low for the three days.
Important factors:- The reliability of this pattern is very high, but still a confirmation in the form of a black candlestick with a lower close or a gap-down is suggested.
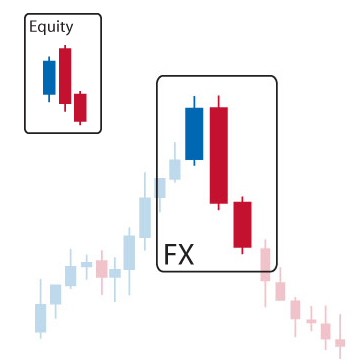
- Market is characterised by an uptrend.
- We see a Bearish Engulfing pattern in the first two days.
- Then we see a black candlestick on the third day with a lower close than the second day.
Bearish Three Outside-Down: The Bearish Three Outside-Down pattern is another name for the Confirmed Bearish Engulfing pattern. By itself this pattern has moderate reliability as a reversal indicator, but when the it is followed by another black day (preferably on strong volume), the overall pattern becomes much more reliable. The third day confirms the bearish trend reversal.
Explanation: The first two days forms a Bearish Engulfing pattern, and the third day confirms the reversal suggested by the Bearish Engulfing pattern since it is a black candlestick closing with a new low for the three days.
Important factors:- The reliability of Bearish Three Outside-Down pattern is very high, but still a confirmation in the form of a black candlestick with a lower close or a gap-down is suggested.
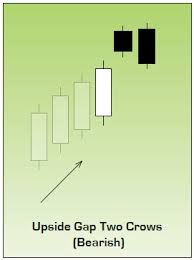
- Market is characterised by an uptrend.
- We see a long white candlestick in the first day that signals the continuation of uptrend.
- Then we see a black body with a gap up on second day.
- The third day is characterized by another black candlestick having an opening above the first black day and also closing below the body of the first black day. The body of third day engulfs the body of the first day.
- The close of the second black candlestick is still above the close of the first long white candlestick.
Bearish Upside Gap Two Crows: The Bearish Upside Gap Two Crows pattern is a three-candlestick pattern and it signals a top reversal. In an uptrend or within a bounce of a downtrend, successive gaps up which close down to force a black candle to form suggests the bulls are weakening. They are not able to rally the share price intraday and the bears are starting to take over. The reliability of the pattern increases if the gaps up bump into resistance. The first candlestick is a long white candlestick followed by a real body that gaps higher. Then another black real body appears, which opens above the second days open and closes under the second day’s close, completing the pattern.
Explanation: The market is in an uptrend and it displays a higher opening with a gap. However the new highs of the day cannot hold and the market forms a black candlestick. However the bulls still comfort themselves by the fact that the close on this black candlestick day is still above the prior day’s close. The third day however increases the bearish sentiment displaying another new high but failing to hold these highs until the close. Also the day closes below the prior day’s close, which is another bearish sign. . So the following question becomes relevant. If the market is so strong, why the new highs fail to hold and why market closes lower? The answer is clear. Market is not now as strong as the bulls would like to believe.
Important factors:- The two black candlesticks of the pattern are the black looking ominous atop a tree branch.
- The Bearish Upside Gap Two Crows pattern is similar to the Bearish Two Crows and Bearish Evening Star patterns.
- Confirmation for the Bearish Upside Gap Two Crows pattern may be mildly suggested. If in the fourth session prices fail to regain high ground, lower prices should be expected.
Advance Block
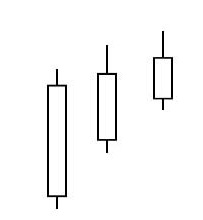
Breakaway
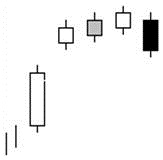
Doji Star
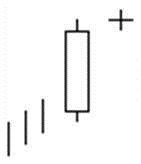
Engulfing
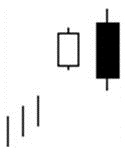
Two Crows
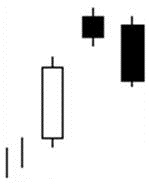
Deliberation
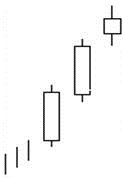
Dragonfly Doji

Gravestone Doji
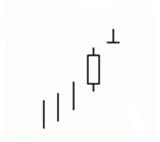
Harami Cross
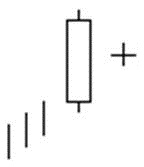
Long-Legged Doji
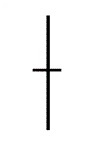
Meeting Lines
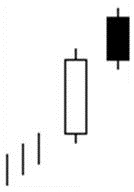
Tri Star
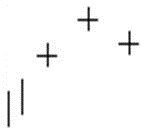
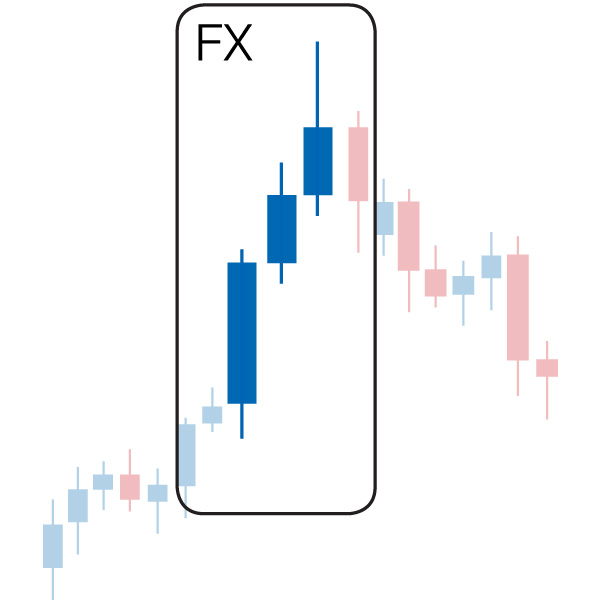
- Market is characterized by an uptrend.
- We see three adjacent white candlesticks with consecutively higher closes.
- Each day opens within the previous day's body.
- Each day’s body is significantly smaller than the body of the previous day.
Bearish Advance Block: The Bearish Advance Block is a pattern characterized by three long white candlesticks with consecutively higher closes during an uptrend. The bodies of each successive candlestick is smaller and closes further from its intraday high with the upper shadows of day two and three getting progressively longer. This is not necessarily extremely bearish, but it is certainly less bullish. It hints that the bounce is losing steam because each attempt to rally intraday fails by a greater degree. The Bearish Advance Block pattern is similar to the Bullish Three White Soldiers pattern. The difference is the fact that each successive day is weaker than the one preceding it. This may suggest that the rally is losing strength and that a reversal is possible.
Explanation: If the second and the third candlesticks (particularly the third) show signs of weakening, this means that the rally is losing steam and the longs must consider protecting their positions. Longs need especially to be careful about the Bearish Advance Block pattern during a mature uptrend. Signs of weakening are the progressively smaller white real bodies or the relatively long upper shadows on the latter two white candlesticks.
Important factors:- A definite deterioration in the upward strength is evidenced by long upper shadows on the second and third days.
- The Bearish Advance Block pattern is not normally a top reversal pattern, but it has the potential to precede a meaningful price decline. This pattern is more important at higher price levels. It suggests liquidating long positions but it is yet too early for short positions.
- The Bearish Advance Block pattern is similar to the Bullish Three White Soldiers and the Bearish Deliberation patterns.
- A confirmation of the reversal on the fourth day would provide the needed proof that the uptrend has reversed. A confirmation of the trend reversal by a black candlestick, a large gap down or by a lower close on the next trading day is suggested.
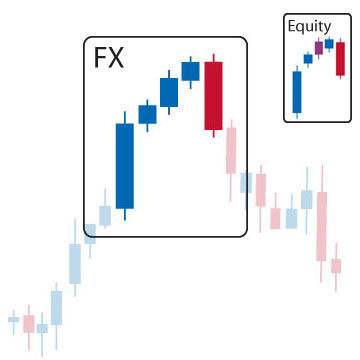
- Market is characterized by an uptrend.
- We see a long white candlestick in the first day.
- Then we see a white candlestick with a gap above the first day on the second day.
- Then we see a white candlestick with a gap above the first day on the second day.
- However, the third and fourth days continue in the direction of the second day with higher consecutive closes.
- Finally, we see a long black candlestick on the fifth day with a closing price inside the gap caused by the first and second days.
Bearish Breakaway: The Bearish Breakaway pattern consists of five candlesticks. A long white day is followed by a white day that gaps above the first day. The next two days continue in the same direction with higher consecutive closes. The final day is a long black day that closes in the gap between the first and second days. We see this pattern during an uptrend marked with a bullish surge that eventually weakens. This weakening is illustrated by a long black candlestick that is unable to close the gap into the body of the first day. These events warn us about a short-term reversal.
Explanation: The Bearish Breakaway pattern is constituted by a gap in the direction of an uptrend or within a bounce of a downtrend, followed by three consecutively higher price days. This shows that the trend has suddenly accelerated with a big gap but then it starts to fizzle, but still manages to move in the same direction. The share price exhausts itself with a gap up and there is evidently a slow deterioration of the trend even though the uptrend continues. Finally, we see a burst in the opposite direction with a long black day suggesting a possible reversal is in the making, completely recovering the previous three days' price action. A possible reversal is also implied by the fact the gap has not been filled. We are now ready for a short-term reversal. Declining volume on the three middle days, with a pickup in volume on the black day, serve as confirmation.
Important factors:- A confirmation on the sixth day is recommended in the form of a black candlestick, a large gap down or a lower close to be sure that there is indeed a reversal.
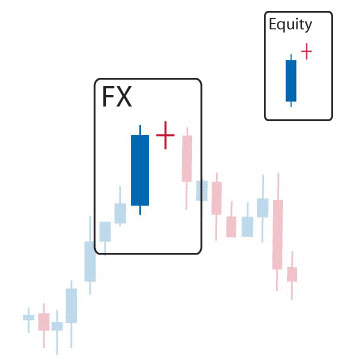
- Market is characterised by an uptrend.
- We see a long white candlestick on the first day.
- Then we see a short candlestick, a spinning top, or a Doji that gaps in the direction of the previous trend on the second day.
- The shadows of the short candlestick, spinning top, or Doji are not long.
Bearish Doji Star: The Bearish Doji Star pattern consists of two candlesticks. A long white candlestick is followed by a Doji that gaps in the direction of the trend. The shadows of the Doji should not be long.
Explanation: In an uptrend or within a bounce of a downtrend, the market gaps up but does not continue its upward movement. Instead enough bears step up to bring supply and demand back into equilibrium and the share price churns in place. The halt of the uptrend signifies the possibility of a reversal, so confirmation is needed with a weak third day (preferably with volume behind it).
Important factors:- The Bearish Doji Star pattern could be the first two days of the Bearish Evening Doji Star or the Bearish Abandoned Baby patterns.
- A confirmation on the third day is required to convincingly show that the uptrend has reversed. This confirmation may be in the form of a black candlestick, a large gap down or a lower close on the next trading day.
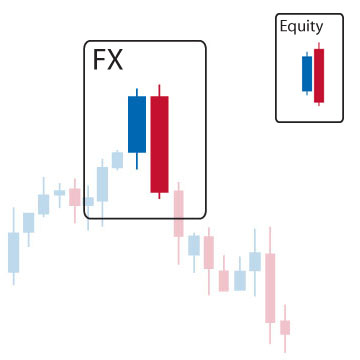
- Market is characterized by an uptrend.
- We see a white candlestick on the first day.
- Then we see a black candlestick that completely engulfs the real body of the first day.
Bearish Engulfing: The Bearish Engulfing pattern is a large black real body, which engulfs a small white real body in an uptrend (it needs not engulf the shadows). The Bearish Engulfing pattern is an important top reversal signal.
Explanation: In an uptrend or within a bounce of a downtrend, the gap up may be the blow out that causes the shorts to throw in the towel and cover positions. Meanwhile the smart money is selling and going short and the selling activity is so intense that the share closes below the previous day's low. The bullish Engulfing pattern is very common…literally dozens occur every day and many are just incidental. Watch volume for confirmation.
Important factors:- Relative sizes of the first and second days are important. If the first day of the Bearish Engulfing pattern is a very small real body (it may even be almost a Doji or is a Doji) but the second day has a very long real body, this shows the dissipation of the prior uptrend’s force and an increase in bearish force.
- A protracted or very fast move increases the chance that potential buyers are already long and that there may be less of a supply of new longs in order to keep the market moving up. A fast move makes the market overextended and vulnerable to profit taking. A Bearish Engulfing pattern appearing after such a move is more likely to be an important bearish reversal indicator.
- A bearish reversal is more possible if there is heavy volume on the second real body or if the second day of the Bearish Engulfing pattern engulfs more than one real body.
- The Bearish Engulfing pattern is similar to the Bearish Dark Cloud Cover pattern and could be the beginning of the Bearish Three Outside Down pattern.
- A confirmation in the third day is required to be sure that the uptrend has reversed. The confirmation may be in the form of a black candlestick, a large gap down or a lower close on the third day.
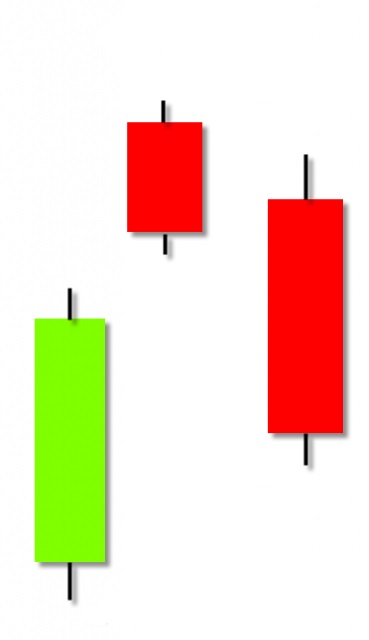
- Market is characterized by an uptrend.
- We see a long white candlestick in the first day.
- Then we see a black candlestick on the second day characterised by a gap up.
- Finally we see a black candlestick whose opening price is inside the body of the second day and which closes inside the body of the first day.
Bearish Two Crows: The Bearish Two Crows pattern consists of three candlesticks. A long white day is followed by a black candle which gaps up in the direction of the trend. The final day opens within the body of the small black day, drops to fill the gap and closes within the body of the first day. It suggests the erosion of the uptrend, and warns about a possible trend reversal.
Explanation: In the Bearish Two Crows pattern, the market is already in an extended uptrend. We see a gap in the opening of the second day. This higher opening is followed by a lower close in this second day warning that there is some weakness in the rally. The third day also opens at a higher price, but not above the open of the previous day, and then prices go down with a close well within the body of the first day. This third day action fills the gap of the second day. It shows that the bullishness started to erode quickly.
Important factors:- The Bearish Two Crows pattern is similar to the Bearish Upside Gap Two Crows and Bearish Evening Star patterns.
- A confirmation on the fourth day is required to show that the uptrend has reversed. This confirmation may be in the form of a black candlestick, a large gap down or a lower close on the fourth day.
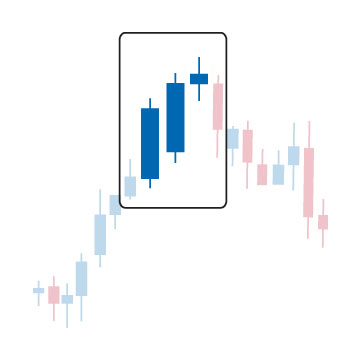
- Market is characterised by an uptrend.
- We see long white bodies on the first and second days.
- The second day has a higher close than the first day.
- Then the third day opens near the second day's close.
- The third day is typically a short white candlestick, a spinning top or a star that gaps above the second day.
Bearish Deliberation: The Bearish Deliberation pattern is a derivative of the Bearish Three White Soldiers pattern. This pattern also shows a weakness similar to the Bearish Advance Block pattern since it becomes weaker in a short period of time. The first two white days say “full speed ahead” as the share price appears strong and in a solid uptrend. However, here the weakness occurs all at once on the third day. The gap up and failure of the small third body of the pattern to rally shows that it is losing strength and a reversal is possible. This is not necessarily bearish, but it is certainly less bullish, so stops are raised, or profits taken on long positions.
Explanation: The Bearish Deliberation pattern appears after a sustained upward move and is suggestive of the fact that the rally is losing strength and a reversal is possible. The formation is a proof that the bulls’ strength is at least temporarily exhausted.
Important factors:- The last small white candlestick may show a gap away from the long white body, thus becoming a star, or it can be riding on the shoulder of the long white real body.
- The Bearish Deliberation pattern is not normally a top reversal pattern but it has potential to precede a meaningful price decline. This pattern is more important at higher price levels. It must be used to liquidate long positions but it is yet too early for short positions.
- The Bearish Deliberation is similar to the Bullish Three White Soldiers and the Bearish Advance Block patterns and could be the beginning of the Bearish Evening Star pattern.
- A confirmation on fourth day is required to confirm that the uptrend has reversed. This may be in the form of a black candlestick, a large gap down or a lower close on the fourth day.
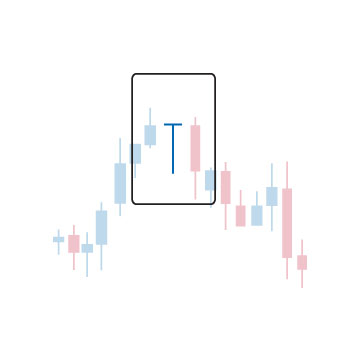
- The market is characterised by an overall uptrend.
- Then we see a Doji at the upper end of the trading range and it is located above the trend.
- Lower shadow of the Doji is extremely long.
- There is no upper shadow.
Bearish Dragonfly Doji: The Bearish Dragonfly Doji pattern is a single candlestick pattern, which occurs at a market top or during an uptrend. The Bearish Dragonfly Doji pattern is very similar to the Bearish Hanging Man pattern. In the case of Bearish Dragonfly Doji pattern, the opening and closing prices are identical whereas the Bearish Hanging Man pattern is characterised by a small real body at the upper end of the trading range.
Explanation: The market is in a bullish mood characterized by an uptrend. Then we see a price action characterized by a sharp sell off when it opens. Prices move down going much lower than the opening price. Then we see a rally in the closing hours of the day, which closes the day at or very near the opening price. However this end-of- day rally signifies the potential for further sell offs. The long lower shadow shows how the market started the day with a sell off. If the market opens lower the next day, we may see a lot of longs eager to sell their positions.
Important factors:- The Bearish Dragonfly Doji is similar to the Bearish Hanging Man, Bullish Dragonfly Doji, and Bullish Hammer patterns. .
- The Bearish Dragonfly Doji pattern is a more bearish and thus, more reliable pattern than the Bearish Hanging Man pattern
- Confirmation of the suggested trend reversal by either a black candlestick, a large gap down or a by a lower close on the next trading day is strongly advised.
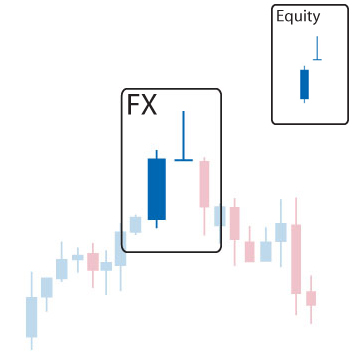
- Market is characterized by an uptrend.
- We see a white candlestick at the higher end of the trading range in the first day.
- Prices open with a gap and we see a Doji with no lower (or almost no) shadow on the second day.
- Upper shadow of the Doji is usually long.
Gravestone Doji: The Gravestone Doji is a pattern in which the opening and closing prices are at the low of the day. The Bearish Gravestone Doji pattern is a top reversal pattern. It appears during an uptrend representing a possible reversal of trend just like its cousin the Bearish Shooting Star pattern.
Explanation: The Gravestone Doji pattern after a rally has bearish implications for the following reason. In an uptrend or within a bounce of a downtrend, the share price gaps up. A valid attempt is made to rally the share price, but the strength subsides and the share price falls to close near the day's low at the same price it opened. Failure to follow through with strength suggests that the bulls may be losing strength. Although this is not necessarily extremely bearish, it is less bullish, so stops should be moved up or profits taken on longs. For a reversal to occur a weak day is needed to confirm the pattern. The Gravestone Doji pattern represents the graves of those bulls that have died defending their territory.
Important factors:- The Bearish Gravestone Doji pattern has more bearish implications than a Bearish Shooting Star pattern.
- The longer the upper shadow and the higher the price level, the more bearish the implications of the Bearish Gravestone Doji pattern will be.
- The Bearish Gravestone Doji pattern is similar to the Bearish Shooting Star, the Bullish Inverted Hammer, and the Bullish Gravestone Doji patterns.
- A confirmation is required on the following day to be more certain about the bearish implications of the Bearish Gravestone Doji pattern. Confirmation may be in the form of the next day opening below the Gravestone Doji. The larger the gap the stronger the confirmation will be. A black candlestick with lower prices can also be another form of confirmation.
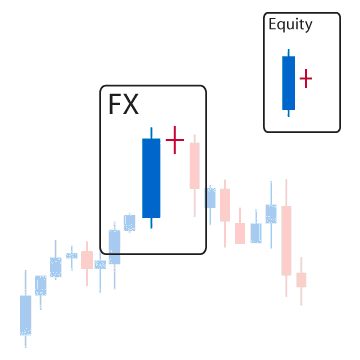
- Market is characterised by an uptrend.
- We see a long white candlestick on the first day.
- Then on the second day we see a Doji completely engulfed by the real body of the first day. The shadows (high/low) of this Doji do not have to be contained within the first, though it is preferable if they are.
Bearish Harami Cross: The Bearish Harami Cross pattern is a Doji preceded by a long white real body. The Bearish Harami Cross Pattern is a major reversal pattern and is more significant than a regular Bearish Harami Pattern.
Explanation: Explanation: The Bearish Harami Cross pattern is a sign of disparity about the market’s health. In an uptrend or within a bounce of a downtrend a long, white real body occurs. The next day's gap down comes as a surprise to bulls who thought they were sitting on a great position the previous day. This shows that the market may not continue in uptrend. Reliability of the Bearish Harami Cross pattern is better than that of the Bearish Harami pattern, but it is still on the low side. A weak following day is needed for confirmation.
Important factors:- While the Bearish Harami pattern is not a major reversal pattern, the Bearish Harami Cross pattern is a major downside reversal pattern. If a Harami Cross appears after a long white candlestick, longs should take notice of it since Harami Crosses call tops very effectively.;
- A confirmation on the third day is required to be sure that the uptrend has reversed. This confirmation may be in the form of a black candlestick, a large gap down or a lower close on the third day.
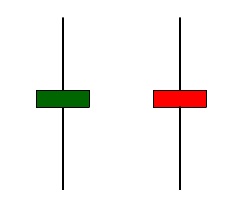
- Market is characterised by an overall uptrend.
- Then we see a Doji that gaps in the direction of the uptrend.
- The real body of the Doji is either a horizontal line or it is significantly small (its length is not more than a few ticks).
- The upper and lower shadows of the Doji are long and almost equal in length.
Long-Legged Doji: The Long-Legged Doji pattern is a Doji characterised by very long shadows. It shows the indecision of the buyers and sellers and it is an important reversal signal.
Explanation: This particular Doji shows that there is a great amount of indecision in the market. A Long-legged Doji shows that the prices traded well above and below the opening price, but closed virtually at the level of the opening price. We have an end result with little change from the initial open despite all the excitement and volatility during the day showing that the market has lost its sense of direction.
Important factors:- The Long-Legged Doji is more important at tops.
- Since the Long-Legged Doji is a single candlestick pattern, it is better to see confirmation in the form of a move opposite to the prior trade on the next trading day.
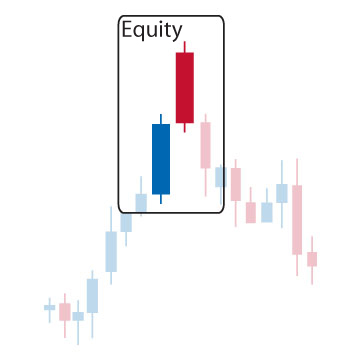
- Market is characteri# Market is characterised by an uptrend.sed by an uptrend.
- We see a long white candlestick in the first day.
- Then we see a long black candlestick, which has a body that is also higher than the previous trend on the second day.
- The close of both days is same or almost same.
- Both of the candlesticks are long but second day candlestick may be shorter than the first.
Bearish Meeting Lines: The Bearish Meeting Lines pattern consists of a long white day, which is followed by a long black day that gaps up at the open but then drops to close at the same price as the white day's close. The market may gap up sharply as it opens but it closes unchanged from the prior session’s close during an uptrend. The Bearish Meeting Lines pattern is a pattern that reflects a balance between the bulls and the bears.
Explanation: In an uptrend or within a bounce of a downtrend a long white day occurs, showing that the bullish momentum is going on. The next day opens higher with a gap and most likely causes the remaining shorts to throw in the towel and cover while the smart money sells and goes short; the share price then drops down to the prior day’s close. So the initial optimism on the second day’s opening now turns into concern for the longs. The identical close of the two candles is considered to be incidental and not extremely important. The fact remains that the shorts were washed out and now profit taking will cause a pullback.
Important factors:- The Bearish Meeting Lines pattern is similar to the Bearish Dark Cloud Cover pattern. The Dark Cloud Cover has the same two-candlestick pattern. The main difference between the two is the fact that the bearish counterattack line does not usually move into the prior session’s white real body. It just gets back to the prior session’s close. The Bearish Dark Cloud Cover pattern’s second line pushes well into the white real body.
- The Dark Cloud Cover pattern is a more important top reversal signal than the Bearish Meeting Lines pattern.
- A confirmation on third day is required to be sure that the uptrend has reversed. This confirmation may be in the form a black candlestick, a large gap down or a lower close on the third day.
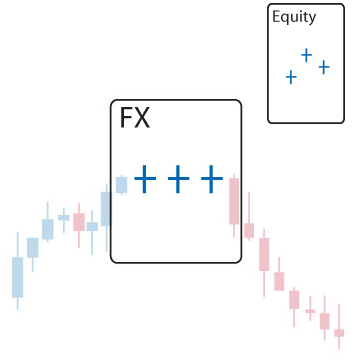
- Market is characterised by an uptrend.
- We see three Dojis on three consecutive days.
- The second day Doji has a gap above the first and third.
Bearish Tri Star: The Bearish Tri Star pattern is a very rare but significant top reversal pattern. It consists of three candlesticks. A Doji occurs on three consecutive trading days, with the second or middle Doji being a Doji Star, which gaps up and the third Doji gaps back down.
Explanation: The Bearish Tri Star pattern appears in a market characterised by an uptrend for a long time. In an uptrend or within a bounce of a downtrend, a battle begins. When the trend starts to show weakness, we see smaller real bodies as the bulls start to back off, while the bears step up. The first Doji is already a matter of considerable concern. The second Doji shows that the market now lost its direction. Finally, the third Doji announces the end of uptrend since this now shows utmost indecision leading to reversal of the positions. Dojis indicate an even battle between the bulls and bears. The formation of three Dojis within a uptrend hints that the bulls may be starting to reassert themselves. A black day with volume is needed to confirm the reversal.
Important factors:- A confirmation on the fourth day is required to show that the uptrend has reversed. This may be in the form of a black candlestick, a large gap down or a lower close on the fourth day.
Belt Hold
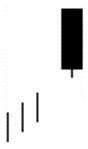
Hanging Man
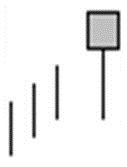
Harami
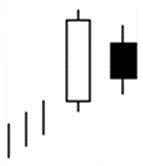
Shooting Star
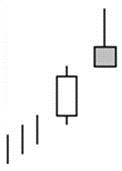
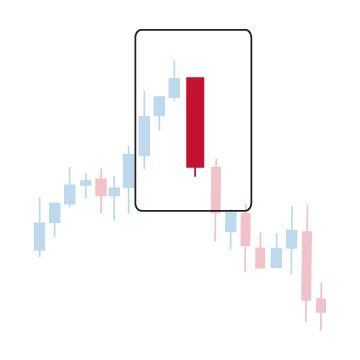
- There is an overall uptrend in the market.
- The day gaps# There is an overall uptrend in the market. up and prices open on their high but then prices move down, closing near the low for the day.
- We then see a black body characterised by the absence of an upper shadow, which is called a Black Opening Marubozu.
Bearish Belt Hold: The Bearish Belt Hold pattern is a single candlestick pattern and it is basically a Black Opening Marubozu or a black day with no upper shadow, and a close near the day's low, that occurs in an uptrend. The pattern shows that the day opens on its high and then rallies against the trend of the market. It then closes near its low but not necessarily at its low. Longer bodies for the Belt Hold pattern are indicative of more resistance to the trend they are countering.
Explanation: The Bearish Belt Hold pattern occurs fairly often and is not very reliable. The fact that the day's opening price holds at the high of the day and the share price trends down all day means bearish, but one really needs to note the overall trend and receive confirmation with an additional down day. We have a market that is trending up when a significant gap in the direction of the trend occurs as the day opens. However; prices then reverse direction and all further price action of the day is the opposite direction of the previous trend. Such a move causes concern among the bulls and leads them to close their positions. This strengthens the reversal and turns into a sell-off.
Important factors:- A confirmation of the trend reversal with either a black candlestick, a large gap down or a lower close on the next trading day is required.
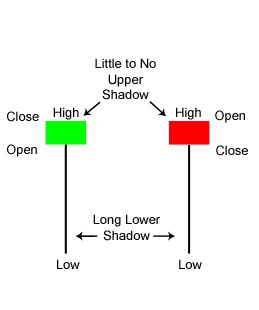
- We see it at a market top or during an uptrend.
- It is characterised by its small real body at the upper end of the trading range and it is located above the trend. The colour of the body is unimportant.
- It has a lower shadow, which is at least twice the height of the real body.
- There is either no upper shadow or a very short upper shadow.
Bearish Hanging Man: The Bearish Hanging Man pattern consists of a single candlestick. It is a top reversal pattern as it signals a market top or a resistance level. It is very similar to the Bearish Dragonfly Doji pattern but in the case of the Bearish Dragonfly Doji pattern, the opening and closing prices are identical, whereas the Bearish Hanging Man pattern has a small real body. A small real body forms at the upper end of the trading range with a long lower shadow (the longer the shadow, the more bearish) with no, or almost no upper shadow.
Explanation: The Bearish Hanging Man is a bearish reversal pattern. In an uptrend or within a bounce of a downtrend, a sharp intraday sell-off is followed by a reversal which causes the share price to close near its opening price and near the day's high. Although the share recovers from its intraday sell-off, it suggests that selling pressure is starting to increase and the bulls are starting to lose strength, and a reversal may occur. Even though the bulls regained their footing and drove prices higher by the finish, the appearance of this selling pressure after a rally is a serious warning signal. The pattern is slightly more reliable if the real body is black. A weak following day on solid volume is still needed to confirm the pattern.
Important factors:- Ideally; the lower shadow of the Bearish Hanging Man pattern must be two or three times the height of the real body. However, a long lower shadow may not have to be twice the height of the real body in the real life conditions in order to signal a reversal. The pattern is more perfect if the lower shadow is longer.
- The Bearish Hanging Man pattern is similar to the Bullish Dragonfly Doji and Bullish Hammer patterns.
- But the Bearish Dragonfly Doji pattern is a more bearish and more reliable signal than the Bearish Hanging Man pattern.
- If a Bearish Hanging Man Pattern is characterised by a black real body, it shows that the close was not able to get back to the opening price level, which has potentially bearish implications.
- We need a confirmation of the reversal on the next day for more definite proof that the uptrend has reversed. This confirmation may be in the form of a black candlestick, a large gap down or a lower close on the next trading day.
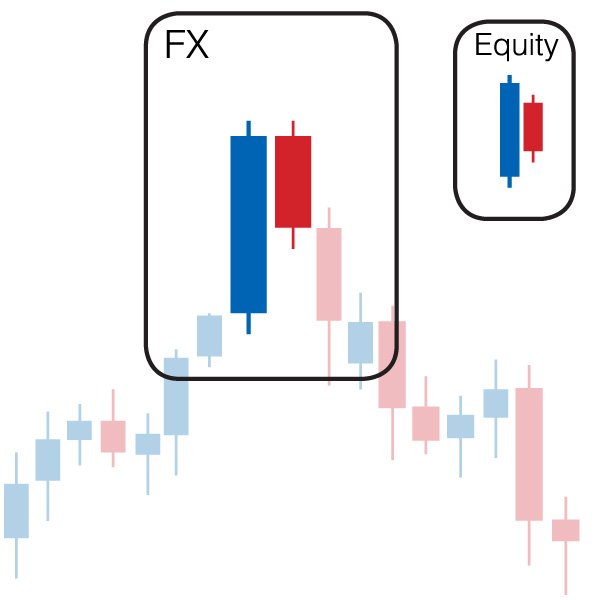
- Market is characterised by an uptrend.
- We see a long white candlestick on the first day.
- Then we see a black candlestick on the second day whose real body is completely engulfed by the real body of the first day. The shadows (high/low) of the second candlestick do not have to be contained within the first body, though it is preferable if they are.
Bearish Harami: The Bearish Harami pattern is a two-candlestick pattern composed of a small black real body contained within a prior relatively long white real body. In other words, a long white day is followed by a black day that gaps down and is completely engulfed by the real body of the first day. “Harami” is an old Japanese word for “pregnant” or “body within”. The long white candlestick is “the mother” and the small candlestick is “the baby”.
Explanation: In an uptrend or within a bounce of a downtrend, a long white day occurs. The next day's gap down comes as a surprise to bulls who thought they were sitting on a great position the previous day. The Bearish Harami pattern is a sign of a disparity about the market’s health. Reliability of the Bearish Harami is low, so a weak following day is needed for confirmation.
Important factors:- The Bearish Harami pattern could be the first two days of Bearish Three Inside Down pattern.
- The Bearish Harami and is the reverse of the Engulfing pattern.
- It is important that the second day black candlestick has a minute real body relative to the prior candlestick and that this small body is inside the larger one. The Bearish Harami pattern does not necessarily mean a market reversal. It rather predicts that the market may not continue with its previous uptrend. There are however some instances in which the Bearish Harami pattern can warn of a significant trend change, especially at market tops.
- A confirmation of the reversal on the third day is required to be sure that the uptrend has reversed. This confirmation may be in the form of a black candlestick, a large gap down or a lower close on the next trading day (the third day).
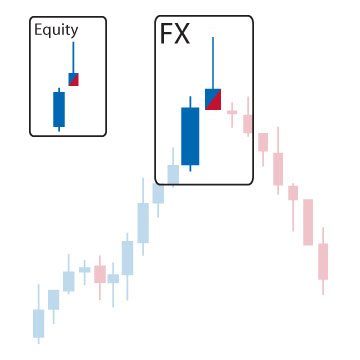
- Market is characterised by an uptrend.
- We see a white candlestick on the first day.
- Prices then open with a gap creating a small real body at the lower end of the trading range on the second day.
- The upper shadow of the pattern on the second day is usually at least twice as long as the real body.
Bearish Shooting Star: The Bearish Shooting Star pattern suggests that prices may be approaching a top. It looks like its name; a shooting star. The shooting star is a small body that forms at the lower end of the trading range, characterised by a long upper shadow, which gaps away from the prior real body. The upper shadow is usually long while the lower shadow is small or almost non-existent.
Explanation: In an uptrend or within a bounce of a downtrend, the share p[rice gaps up. A valid attempt is made to rally the share, but the strength subsides and the share price falls to close near the day's low and near its opening price. Failure to follow through with strength suggests that the bulls may be losing strength. Although this is not necessarily extremely bearish, it is less bullish, so stops should be moved up or profits taken on the longs. For a reversal to occur, a weak day is needed to confirm the pattern. The Shooting Star pattern simply tells us that the rally of the day was not sustainable.
Important factors:- The Bearish Shooting Star pattern is similar to the Bullish Inverted Hammer, the Bearish Gravestone Doji, and the Bullish Gravestone Doji patterns.
- The Bearish Shooting Star pattern is usually not a major reversal signal as is the Evening Star pattern.
- The colour of the real body is not important.
- An ideal Shooting Star has a real body which gaps away from the prior real body. Nonetheless, this gap is not always necessary.
- A confirmation on the third day is required to be sure that the uptrend has reversed. The confirmation may be in the form of a black candlestick, a large gap down or a lower close on the next trading day.
Falling 3 Methods
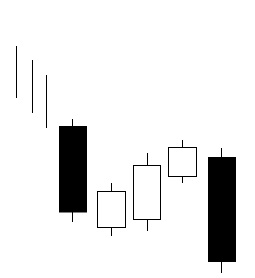
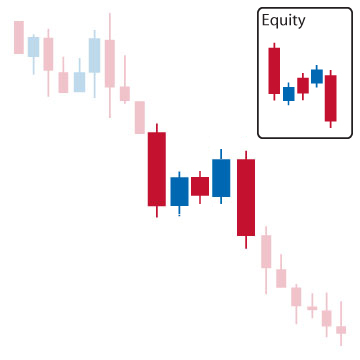
- Market is characterised by a downtrend.
- We see a long black candlestick on the first day.
- We then see three small real bodies defining a brief uptrend on the second, third, and fourth days. However, these bodies stay within the range of the first day.
- Finally we see a long black candlestick on the fifth day opening near the previous day’s close and also closing below the close of the initial day to define a new low.
Bearish Falling Three Methods: The Bearish Falling Three Methods pattern needs five candlesticks and is a continuation pattern as it shows a temporary break or pause in the trend of prices without causing a reversal. In a downtrend, a long black day in a downtrend, is followed by a brief bounce (preferably on light volume), which is then followed by three relatively small candles that move opposite the overall trend but stay within the range of the first day. The fifth day is a long black day that closes below the close of the first day and continues the downtrend. The small uptrend between two long black days simply shows a market break or nothing more than a few days off for the bears. After this temporary break, the fifth day simply continues the trend.
Explanation: The Bearish Falling Three Methods pattern is a continuation pattern marked with a temporary break in the overall trend of prices without causing a reversal. The temporary break shows that there is some doubt about the ability of the trend to continue. This doubt increases as the small-range reaction days take place. However, given the fact that a new high cannot be made, the bearishness is resumed and new lows are set quickly.
Important factors:- The high-low range includes the shadows.
- The reliability of this pattern is very high. However, a confirmation in the form of a black candlestick with a lower closing is still suggested.
Downside Gap 3 Methods
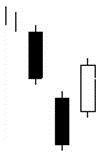
Downside Tasuki Gap
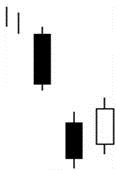
In Neck
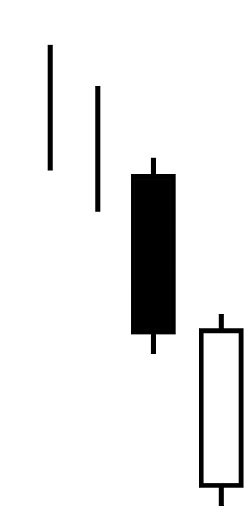
On Neck
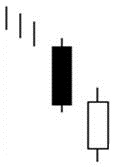
Side-By-Side White Lines
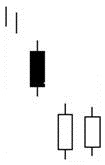

- Market is characterised by a downtrend.
- We see two long black candlesticks with a gap between them in the first and second days.
- Then we see a white candlestick on the third day characterized with an opening within the body of the second day.
- The body of third day candlestick is white and it fills the gap between the first two days.
Bearish Downside Gap Three Methods: The Bearish Downside Gap Three Methods pattern consists of a long black day, which is followed by a second long black day that gaps in the direction of the trend. The third day is white and fills the gap between the first two days. In a downtrend a gap simply gets filled. As long as the black candles have higher volume than the white, the one white profit taking day for the shorts should not be a big concern. It should be seen as a support for the downward trend, which should continue if indeed the share price is as weak as it appears.
Explanation: The Bearish Downside Gap Three Methods pattern appears when the market is moving strongly downward. The downward move is extended further by another day showing a gap in the direction of the downtrend. The third day open is well within the body of the second day, and it manages to completely fill the gap. This gap-closing move may be interpreted as a support level for the current downtrend.
Important factors:- This Bearish Downside Gap Three Methods pattern is a simple pattern with strong similarity with the Bearish Downside Tasuki Gap pattern. The only difference is that in the Bearish Downside Tasuki Gap pattern, the gap between the first two days is not filled by a third day body.
- A confirmation of the trend is required in the form of a black candlestick, a large gap down or a lower close on the next trading day to be sure that downtrend is continuing.
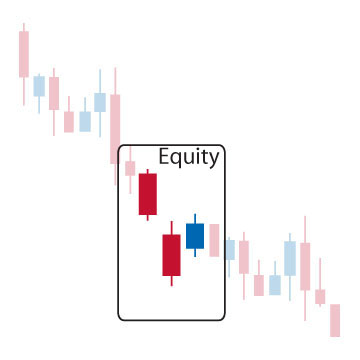
- Market is characterised by a downtrend.
- We see two long black candlesticks with a gap between them in the first and second days.
- Then we see a white candlestick characterized with an opening within the body of the second day.
- The body of third day candlestick closes into the gap but does not fully close the gap.
Bearish Downside Tasuki Gap: The Bearish Downside Tasuki Gap pattern involves two long black candlesticks with a downward gap between them during a downtrend. The pattern is completed by a third day white candlestick partially closing the gap between the first two. The white candlestick may be the result of investors temporarily taking advantage of the low buying price. However we expect the trend to continue in the downward direction.
Explanation: The Bearish Downside Tasuki Gap pattern consists of a long black day that is followed by a second long black day that gaps in the direction of the trend. The third day is white and opens within the body of the second day and closes within the gap. In a downtrend a gap is partially filled. This is simply a profit taking scenario for the shorts and a sucker entry for dumb longs. We have a weak share price in a downtrend that bounces. As long as the white day is on lighter volume, the bears will most likely retake control soon after. The Bearish Downside Tasuki Gap pattern appears in a strongly downward moving market. The downward move is extended further by another day, which displays a gap in the direction of the downtrend. The third day has an opening well into the body of the second day and it partially fills the gap. However, the gap is not filled or closed, so previous downward trend continues.
Important factors:- The Bearish Downside Tasuki Gap pattern is a rare candlestick pattern.
- The real bodies of the last two candlesticks in the Bearish Downside Tasuki Gap pattern should be about the same size.
- This Bearish Downside Tasuki Gap pattern is a simple pattern quite similar to the Bearish Downside Gap Three Methods pattern. The only difference is that in the Bearish Downside Gap Three Methods pattern, the gap that is made between the first two days is filled by the third day.
- A confirmation is recommended in the form of a black candlestick, a large gap up or a lower close on the next trading day to be sure that downward trend will continue.
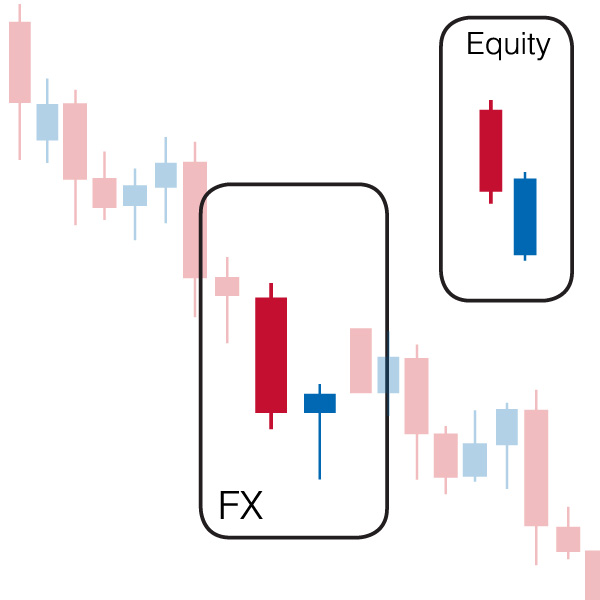
- Market is characterized by downtrend.
- We see a long black candlestick on the first day.
- Then we see a white candlestick on the second day with an opening price that is below the low of the previous day and whose closing price is barely above or equal to the closing price of the previous day.
Bearish In Neck: The Bearish In Neck pattern is characterized by a white candlestick that has a closing price slightly above the previous black candlestick’s low during a downtrend. If the white candlestick’s low is broken down, the downtrend continues.
Explanation:
The Bearish in Neck pattern is an undeveloped version of the Bullish Piercing Line pattern with a much lower close. A long black day is followed by a long white day that gaps down at the open and closes at the same price as the black day. The white body on second day closes near the close of the previous black day, at the lower part of the body.
The actual definition requires a closing price just inside the previous day's body and slightly above its close. So it is a higher close than the Bearish On Neck pattern, but not much. The In Neck pattern is a less severe relative of the On Neck pattern because it rallies further intraday. A gap down is seen as a buying and short covering opportunity, but failure to rally the stock up into the previous day's range indicates the buying most likely will be brief and the downtrend shall resume.
- The white candlestick of the Bearish In Neck pattern must be small.
- The Bearish In Neck pattern is similar to the Bullish Piercing Line, the Bearish On Neck, the Bearish Thrusting, and the Bullish Meeting Lines patterns.
- Confirmation is required on third day in the form of a black candlestick, a gap down or a lower close.
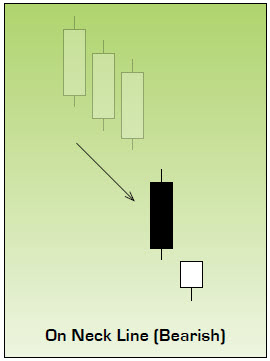
- Market is characterized by downtrend.
- We see a long black candlestick in the first day.
- Then we see a white candlestick on the second day, which opens below the low of the previous day. This day does not need to be a long day or it might resemble the Bullish Meeting Line pattern.
- The closing price of the second day is either the low price of the first day or almost same.
Bearish on Neck: The Bearish on Neck pattern is a long black day is followed by a long white day that gaps down at the open and closes below the close of the black day. The white candlestick is characterized by a closing price near the low of the black candlestick during a downtrend. If the low of white candlestick is broken down, the market goes further down.
Explanation:
The Bearish On Neck pattern is a more severe relative of the In Neck pattern because it fails to rally as much intraday. A gap down is seen as a buying and short covering opportunity, but failure to rally the stock up into the previous day's range indicates the buying most likely will be brief and the downtrend will resume.
The Bearish On Neck pattern is an undeveloped version of the Bullish Piercing Line pattern. It is a similar pattern except that the second day's white body only gets up to the previous day's low. The Bearish On Neck pattern usually appears during a decline and is a typical pattern in a downtrend. Bearishness increases with the long black first day. The market shows a gap down on the second day, but cannot continue the downtrend. Prices start going up but they stop at the previous day's low price. This bearish occurrence is uncomfortable for potential bottom pickers. The downtrend may continue for a short while longer.
- The Bearish On Neck pattern is similar to the Bullish Piercing Line, the Bearish In Neck, the Bearish Thrusting, and the Bullish Meeting Lines patterns.
- The likelihood of the downward trend increases if the trading volume on the second day is high.
- Confirmation on third day is required in the form of a black candlestick, a gap down or a lower close.
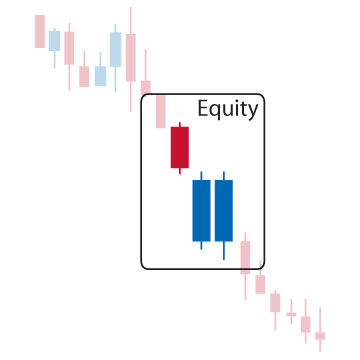
- Market is characterised by a downtrend.
- We see a black candlestick in the first day.
- Then we see a white candlestick gapping down on second day.
- Finally we see a white candlestick, which is almost the same size and is also marked with an opening price at about the same price as the opening price of the second day.
Bearish Side-By-Side White Lines: The Bearish Side-By-Side White Lines pattern needs three candlesticks. It is formed by a black day, which is followed by a white day that gaps in the direction of the trend. The third candle is also white and is almost identical to the previous day. This suggests that the shorts are covering their positions, and no reversal is expected soon. The downtrend is likely to remain intact for the near future.
Explanation: In a downtrend a black day is followed by two white days that are gapped below the first day. The lack of follow through on the second white day suggests that the bears are still somewhat in control, and unless the bulls can fill that overhead gap with some volume behind the move, the downtrend will remain intact. Alternatively, there is evidence of resistance to further downside action, which impels the shorts to cover their positions causing a third day rally and leading to a higher close. However it is again not high enough to close the initial downward gap. As short covering ends, prices should move lower.
Important factors:- This Bearish Side By Side White Lines pattern is a very rare pattern.
- The two side-by-side white candlesticks after gapping below a black candlestick are not only of similar size, but also the opening price should be very close.
- A confirmation is recommended in the form of a black candlestick, a large gap down or a lower close on the next trading day to be sure that downtrend will continue.
Separating Lines
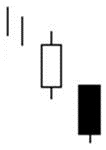
Three Line Strike
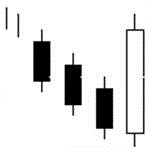
Thrusting
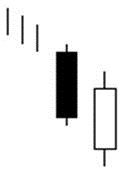
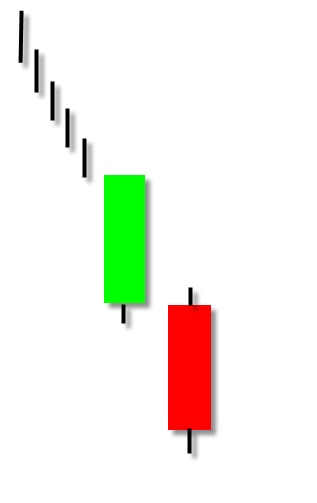
- The market is characterized by a downtrend.
- We see a long white candlestick on the first day.
- Then we see a black body, which has the same opening price as the first day, or extremely close to it.
- Then we see a black body, which has the same opening price as the first day, or extremely close to it.
- The second day candlestick is a Black Opening Marubozu.
Bearish Separating Lines: The Bearish Separating Lines pattern is characterized by two candlesticks. It is a white candlestick followed by a black candlestick that has the same opening price.
Explanation:
In a downtrend, the price gaps down and then bounces intraday with a white candle. This proves to be simple profit taking by the shorts and bottom fishing by the dumb longs when the downtrend continues with the next day's gap down and lower close. It shows an opening price equal to the prior day’s opening price and also a lower closing price, which is a Black Opening Marubozu.
A white real body (especially a relatively long one) is a matter of concern for the shorts during the downtrend. It shows that the bulls may be gaining control. However, if the next day opens with a downward gap and an opening price equal to the previous day’s opening price, this reinstates the bear confidence. If furthermore the day closes lower, the bears feel even more confident about the fact that the downtrend will continue.
- The black candlestick must be a Black Opening Marubozu.
- The Bearish Separating Lines pattern is similar to the Bearish Kicking pattern.
- A confirmation on the third day is required to justify that the downtrend is still strong. The confirmation may be in the form of a black candlestick, a large gap down or a lower close on the third day.
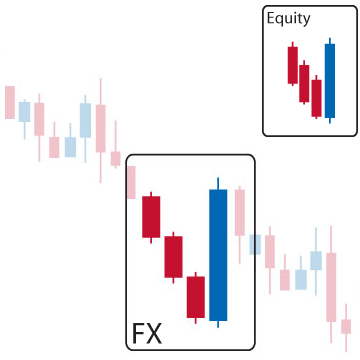
- Market is characterised by a downtrend.
- We see three long black candlesticks with consecutively lower closes.
- Then we see a white candlestick on the fourth day opening at a lower level and closing above the open of the pattern’s first day.
Bearish Three Line Strike: The Bearish Three Line Strike pattern is characterized by three long black candlesticks with consecutively lower closes. This is followed by a fourth day that gaps in the direction of the trend but closes above the open of the first day of the pattern. If there was a strong bearish trend before the pattern, then it should continue.
Explanation: The Bearish Three Line Strike pattern appears during a downtrend as evidenced by the three black candlesticks but the pattern has low reliability. We see an opening on the fourth day that opens in the direction of the downtrend, but now shorts start covering their positions causing the prices to move strongly in the opposite direction. This may lead to doubts about market direction. However it is also a fact that this move completely eradicated the move of the previous three days. So this day should be looked upon as a day that gave the shorts the chance of being covered and if the bearish trend was strong before the pattern, the downward move should continue.
Important factors:- The Bearish Three Line Strike pattern is a possible continuation of the Bearish Three Black Crows pattern.
- A confirmation on the fifth day in the form of a black candlestick, a large gap down or a lower close is definitely required.
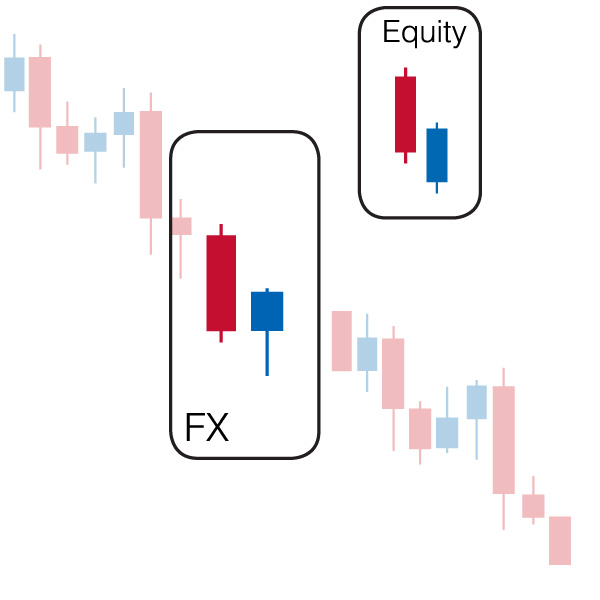
- Market is characterised by a downtrend.
- We see a black candlestick on first day.
- Then we see a white candlestick, which opens considerably lower than the low of the first day.
- The second day candlestick closes well into the body of first black candlestick, but not above the midpoint.
Bearish Thrusting: The Bearish Thrusting pattern is characterised by a black candlestick, which is followed by a white candlestick that gaps in the direction of the down trend and closes within the prior black real body, but still below the midpoint of the black candlestick. The Bearish Thrusting pattern is a bearish signal in a downtrend.
Explanation:
The Bearish Thrusting pattern shows a rally failure in a down market. The fact that the second day's close does not even reach the midpoint of the first day's body discourages the bulls and the downtrend continues due to lacking of buying.
The Thrusting pattern is a weaker version of the Bearish On Neck and the Bearish In Neck continuation patterns. The bulls start to assert themselves as evidenced by the rally into the previous day's trading range, but by closing in the lower half of that range, the overall pattern is still bearish.
- The Bearish Thrusting pattern is similar to the Bullish Piercing Line, the Bearish On Neck, the Bearish In Neck, and the Bearish Meeting Lines patterns.
- A confirmation of downtrend by a black candlestick, a gap down or by a lower close on the next trading day (the third day) is required.
Long White Candlestick
White closing Marubozu
White Marubozu
White Opening Marubozu
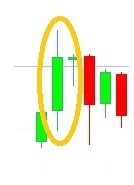
- The real body of the Long White Candlestick has a relatively longer length relative to other candlesticks on the chart.
- The sizes of the upper and lower shadows are not important.
Long White Candlestick: The Long White Candlestick is a signal indicating strong buying pressure.
Explanation:
The Long White Candlestick shows strong buying pressure. A longer white candlestick is indicative of the fact that the closing price is further
above the opening price. The Long White Candlestick shows that the prices advanced significantly from
open to close during the day under strong buying pressure and buyers were aggressive.
The Long White Candlestick is generally a bullish pattern. However, its position within the broader technical picture is also important.
For example; Long White Candlesticks may show a potential turning point or they may show that prices have reached a support level if they are seen after
an extended decline. If a Long White Candlestick is seen after a long and significant rally, it can point out excessive bullishness in the market
that says that prices are at dangerously high levels.
- The Long White Candlestick is a single candlestick pattern and it is not reliable as such. It reflects only one day's trading. It may show continuation of a trend, as well as a possible reversal. Adjacent candlesticks must be taken into consideration for a healthier decision regarding the status of the trend.
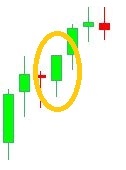
- A White Closing Marubozu has a lower shadow but no upper shadow.
- The day opens, the prices then slightly go lower creating the lower shadow but then prices continue to go up all day thus forming a long white day.
- The day then closes at the high of the day and hence with no upper shadow.
White Closing Marubozu: The White Closing Marubozu is a single candlestick pattern characterized by a long white body with no upper shadow. This is an extremely strong bullish candlestick pattern.
Explanation: The White Closing Marubozu is a single candlestick pattern characterized by a long white body with a shadow on the open and but no shadow on the closing end of the body. This candlestick shows that the day opened and then prices went slightly lower slightly. However, it was followed by a rally that drove the prices over the opening price and the rally continued all day ending with a closing price equal to the high of the day. Hence the bulls were very strong during the day except the initial phase of the session. The bull strength caused some concern among the bears leading them to cover their short positions thus adding fuel to the rally.
Important factors:- What a White Closing Marubozu says about the future course of the prices depends a lot on the general picture just as in the case of White Marubozu. White Closing Marubozu can possibly be the first part of a bullish continuation pattern or it may also be interpreted as a bearish reversal candlestick pattern depending on the preceding day's candlesticks.
- The White Closing Marubozu is a single candlestick pattern with low reliability. It only reflects one day's trading and it may show the continuation of the trend but it may also indicate reversal. It needs to be used with other candlesticks for a better and healthier judgement about the status of the trend.
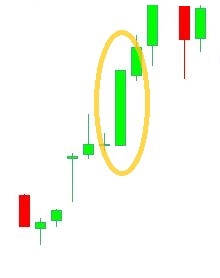
- A white Marubozu does not have upper or lower shadows.
- The day opens and prices continue to go up all day thus forming a long white day with no lower shadow.
- The day also closes at the high of the day and hence no upper shadow.
White Marubozu: The White Marubozu is a single candlestick pattern characterised by a long white body having no shadows on either end. Marubozu means there are no shadows from the bodies. It is an extremely strong bullish candlestick pattern.
Explanation: A White Marubozu pattern simply means that the opening price is equal to the low price of the day and the closing price is equal to the high price of the day. This shows that the buyers controlled the price action from the first trade to the last trade. In a White Marubozu day, the day opens and prices continue to rally up all day long without looking back. The bulls were very strong during the day at such a degree that it caused some concern among the bears and led them to cover their short positions thus adding fuel to the rally.
Important factors:- What the White Marubozu says about the future course of the trend depends a lot on the general picture. A White Marubozu can possibly be the first part of a bullish continuation pattern but it may also be interpreted as a bearish reversal candlestick pattern depending on the preceding day's candlesticks.
- The White Marubozu is a single candlestick pattern and consequently it has low reliability. It reflects only one day's trading and it may show the continuation of the trend but also may indicate reversal. It needs to be used with other candlesticks
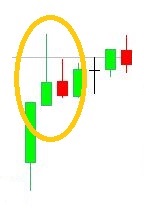
- A White Opening Marubozu does not have lower shadow but it has an upper shadow.
- The day opens and prices continue to go up all day long forming a long white body with no lower shadow.
- The prices close over the opening price but not at the high of the day thus creating an upper shadow.
White Opening Marubozu: The White Opening Marubozu is a single candlestick pattern characterised by a long white body. It has an upper shadow but no lower shadow. This is a strong bullish candlestick pattern.
Explanation: The White Opening Marubozu is a single candlestick pattern characterized with a long white body displaying a shadow on the closing side and but no shadow on the opening side. This shows that the day opened and then the prices continued to go up all day long without coming below the opening level thus forming a long white body, however prices did not close at the high of the day and thus they created an upper shadow. It is a typical bull day and strength of the bulls is enough to cause some concern among the bears. A White Opening Marubozu, on the other end, does not show as much bullish strength as in the case of White Marubozu.
Important factors:- Like all other Marubozu, what a White Opening Marubozu says about the future course of the prices depends a lot on the general picture. It may be the first part of a bullish continuation pattern but it may also be interpreted as a bearish reversal pattern depending on the preceding day's candlesticks.
- In the case of downtrend, a White Opening Marubozu is called a Bullish Belt Hold pattern.
- The White Opening Marubozu is a single candlestick pattern with low reliability. It reflects only one day's trading and it may show the continuation of the trend but may also indicate a reversal. It needs to be used with other candlesticks for a better and healthier judgement about the status of the trend.
Black Candlestick

Black Spinning Top
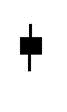
Doji Pattern
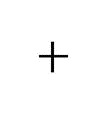
Four Price Doji
Short Black Candlestick
Short White Candlestick

White Candlestick
White Spinning Top
High Wave
Inverted Umbrella
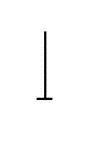
Long-Legged Doji

Umbrella
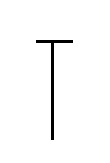
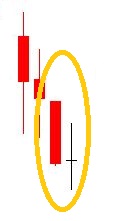
- The real body of this pattern is black with normal length.
- The upper and lower shadows are smaller than the length of the real body.
Black Candlestick: The Black Candlestick pattern represents normal selling pressure.
Explanation: Selling pressure is indicated by a Black Candlestick pattern. The pattern shows that prices declined from open to close during the day and sellers were in control throughout this process.
Important factors:- Like most other single candlestick patterns the Black Candlestick pattern has low reliability. It reflects only one day's trading and can be interpreted both as a continuation and a reversal pattern. The pattern must be used with other candlesticks for a better or healthier confirmation of a trend.
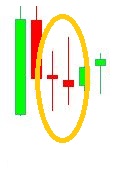
- The real body of the pattern is black and small.
- The upper and lower shadows are longer than the real body's length.
Black Spinning Top: The Black Spinning Top pattern is a single candlestick pattern. Its shape is a small black body with upper and lower shadows having a greater length than the body's length.
Explanation: The market moves higher and then sharply lower, or vice versa. It then closes below the opening price creating a black body. This represents complete indecision between the bulls and the bears. The actual length of the shadows is not important. The small body relative to the shadows is what makes the spinning top.
Important factors:- If a Black Spinning Top pattern is observed after a long rally or a long white candlestick, this implies weakness among the bulls and it is a warning of a potential change or interruption in trend.
- If a Black Spinning Top pattern is observed after a long decline or a long black candlestick, this implies weakness among the bears and it is a warning of a potential change or interruption in trend.
- Like most other single candlestick patterns, the Black Spinning Top pattern has low reliability. It reflects only one day's trading and can be interpreted both as a continuation and as a reversal pattern. This pattern must be used with other candlesticks for a better and healthier confirmation of a trend.
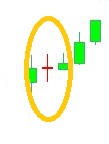
- The real body is either a horizontal line or it is significantly small (its length is not more than a few ticks).
- The upper and lower shadows vary in length.
Doji pattern: The Doji pattern occurs when a share price has virtually equal opening and closing prices. The length of the upper and lower shadows of a Doji can vary and consequently the resulting candlestick may look like a cross, inverted cross or a plus sign. The Doji, taken alone, is a neutral pattern, meaning that it neither describes the market as bullish nor bearish.
Explanation: The open and close should be equal in an ideal Doji. However, in real life it is unfortunately not that simple. A Doji with an equal open and close may be considered more robust but it is also rare in real life. Hence it is more important to capture and understand the essence of this important candlestick. Upon seeing a Doji in an over-bought or oversold condition, (over-bought or oversold conditions can be defined by using indicators such as the Stochastic indicator), becomes an extremely high probability reversal situation. Doji is a particular signal showing indecision about the direction of the market and it represents a tug of war between buyers and sellers. A Doji simply shows that prices has moved above and below the opening price during the day, but then the security closed either exactly at or very near the opening price. The overall result is a standoff. It shows that neither the bulls nor the bears were able to gain control during the day and it is possible that a turning point can develop soon.
Important factors:- The Doji pattern is an important candlestick. It provides information on its own. It also features in other formations as an important element.
- Doji is relatively easy to spot. It has a very small body with the appearance of a thin horizontal line. The very small body relative to other candlesticks is its distinguishing characteristic.
- The Doji pattern needs to be interpreted in terms of a preceding trend or preceding candlesticks. The appearance of a Doji after an advance or a long white candlestick signals the fact that the buying pressure is getting weaker. The appearance of a Doji after a decline or a long black candlestick signals the fact that the selling pressure is diminishing. Essentially Doji gives the message that the forces of supply and demand are becoming more evenly matched and consequently a change in trend may be near. However Doji alone is not enough to identify a reversal and further confirmation by following signals may be warranted.
- The importance of the Doji pattern as a signal is somewhat relative and depends on the characteristics of the market. It is actually important only in markets where you do not see many Doji. If there are many Doji on a particular chart, the appearance of a new Doji in that particular market is not very meaningful and its signal value is negligible.
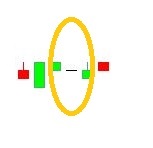
- The body is a horizontal line.
- There are no upper or lower shadows at all.
- The open, close, high and low are the same throughout the entire day.
Four Price Doji: The Four Price Doji pattern is a single candlestick pattern. It is simply a horizontal line that has no upper or lower shadows.
Explanation: A Four Price Doji pattern is a very rare occurrence and it may be seen only if all the four price components are equal. That is, the open, high, low, and close turn out to be the same. It represents complete and total uncertainty by traders concerning the market direction.
Important factors:- The Four Price Doji pattern usually occurs when a share is very illiquid, has low volume, or the data source do not report any other price other than the closing price.
- The Four Price Doji pattern is not reliable like most other single candlestick patterns. It only reflects one day's trading and conveys a sense of complete indecision. It usually is interpreted as a reversal pattern however this indicator must be used with other candlesticks for a healthier judgement about the course of the trend.
- Like all other Doji types, the Four Price Doji pattern is also important only in markets where there are not many Doji patterns. In a chart characterised by many Doji patterns, the emergence of the Four Price Doji pattern does not have a signal value.
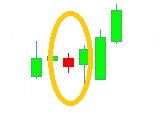
- The real body of this pattern is black and short.
- The upper and lower shadows are smaller than the length of the real body.
Short Black Candlestick: The Short Black Candlestick pattern implies relatively weak selling pressure with little price movement.
Explanation: The Short Black Candlestick pattern signals a possible consolidation.
Important factors:- Like most other single candlestick patterns, the Short Black Candlestick pattern has low reliability. It reflects only one day's trading and can be interpreted both as a continuation and a reversal pattern. It must be used with other candlesticks for a better and healthier confirmation of a trend.
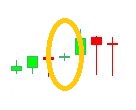
- The real body of the candle is white and small.
- The upper and lower shadows are smaller than the length of the real body.
Short White Candlestick: The Short White Candlestick pattern represents relatively weak buying pressure with little price movement.
Explanation: The Short White Candlestick pattern signals consolidation.
Important factors:- The Short White Candlestick pattern is not reliable since it is a single candlestick pattern. Only one day’s trading is reflected in this pattern. It may show continuation of the trend, as well as a reversal. Other neighbouring patterns must be taken into consideration for a healthier decision regarding the status of the trend.
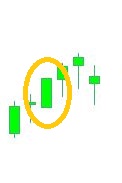
- The real body of the pattern is white with normal length.
- The upper and lower shadows are smaller than the length of the real body.
White Candlestick: The White Candlestick pattern represents normal buying pressure.
Explanation: The White Candlestick pattern shows buying pressure. It shows that prices advanced from open to close during the day and buyers were in control.
Important factors:- The White Candlestick pattern is not a reliable pattern like most other single candlestick patterns. Only one day’s trading is reflected in a White Candlestick pattern. Hence it has potential to be interpreted as a continuation pattern as well as a reversal pattern. The neighbouring candlesticks must be taken into account to have a healthier decision if the trend is continuing or not.
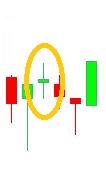
- The real body of the pattern is white and small.
- The upper and lower shadows are longer than the real body's length.
White Spinning Top: The White Spinning Top pattern is a single candlestick pattern. Its shape is a small white body with upper and lower shadows that have a greater length than the body's length.
Explanation: The market moves higher and then sharply lower, or vice versa. It then closes above the opening price creating a white body. This represents complete indecision between the bulls and the bears. The actual length of the shadows is not important. The small body relative to the shadows is what makes the spinning top.
Important factors:- If a White Spinning Top pattern is observed after a long rally or a long white candlestick, this implies weakness among the bulls and it is a warning about a potential change or interruption in trend.
- If a White Spinning Top pattern is observed after a long decline or a long black candlestick, this implies weakness among the bears and it is a warning about a potential change or interruption in trend.
- Like most other single candlestick patterns, the White Spinning Top pattern has low reliability. It reflects only one day's trading and can be interpreted both as a continuation and a reversal pattern. This candlestick pattern needs to be used with other candlesticks for a healthier confirmation of a trend.
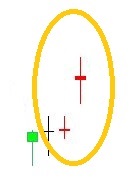
- The real body of the candlestick is small. Its colour is not important.
- Either the upper or the lower shadow, or both shadows are long.
High Wave: The High Wave pattern is a type of candlestick characterized with either a very long upper or a lower shadow. It has only a short real body. A group of these patterns may signal a market turn.
Explanation: The High Wave just like Long-Legged Doji shows that there is a great amount of indecision in the market. This pattern is formed when prices trade well above and/or below the day's opening price, but then the price closes almost at the same level as the opening price. It means that the end result is not different from the initial open despite the whole excitement and volatility during the day. The pattern implies a loss of sense of direction and that there is a great amount of indecision in the market. A group of high wave candlesticks signal a possible reversal in the market.
Important factors:- The High Wave pattern is especially important at market tops.
- The High Wave pattern is also a single candlestick pattern. Hence a confirmation is definitely required in the form of an opposite move to the prior trade on the next trading day in order to judge that a reversal may be starting.
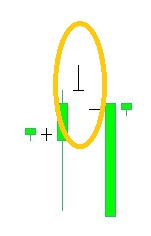
- The real body of the Inverted Umbrella pattern is either a horizontal line or it is significantly small (its length is not more than a few ticks).
- There is no lower shadow.
- The upper shadow is long.
Inverted Umbrella: The Inverted Umbrella pattern is characterized by having no lower shadow and but a long upper shadow. The long upper shadow shows the evidence of selling pressure, but the position of the high price indicates that plenty of buyers are still around. The Inverted Umbrella is a reversal pattern.
Explanation: The Inverted Umbrella pattern indicates that buyers dominated the trading and they were able to drive the prices higher during the day. However, sellers resurfaced by the end of the day and pushed prices back to the opening price level and to the day’s low.
Important factors:- The Inverted Umbrella pattern has the potential to point out evidence of buying pressure and indicate a potential bullish reversal if it appears after a long downtrend, a long black candlestick or if it is seen at a visible support level.
- Likewise it may show a failed rally and indicate a potential bearish reversal if it appears after a long uptrend, a long white candlestick or if it is seen at a visible resistance level. Bearish or bullish confirmation is required in both situations.
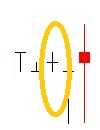
- The real body of the Long-Legged Doji pattern is either a horizontal line or it is significantly small (its length is not more than a few ticks).
- Both of the upper and lower shadows are long and they are almost equal in length.
Long-Legged Doji: The Long-Legged Doji pattern is characterised by very long shadows. It is an important reversal signal.
Explanation: The Long Legged Doji shows that there is a great amount of indecision in the market. This pattern is formed when prices trade well above and below the day's opening price, but then close almost at the same level as the opening price. It means that the end result is not different from the initial open despite the whole excitement and high volatility during the day. This implies a loss of sense of direction and that there is a great amount of indecision in the market.
Important factors:- # The Long Legged Doji pattern is especially important at market tops.
- # The Long Legged Doji pattern is a single candlestick pattern. Hence, a confirmation is definitely required in the form of an opposite move to the prior trade on the next trading day in order to judge that a reversal may be starting.
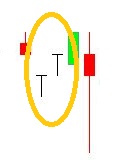
- The real body is either a horizontal line or it is significantly small (its length is not more than few ticks).
- There is no upper shadow.
- The lower shadow is long.
Umbrella: The Umbrella pattern is a type of a Doji characterised with no upper shadow but a long lower shadow. The long lower shadow shows the evidence for buying pressure, but the position of the low price indicates that plenty of sellers still are around. The Umbrella pattern is interpreted as a reversal pattern.
Explanation: The Umbrella pattern indicates that sellers mostly dominated trading during the day and they were able to drive the prices lower during the day. However; buyers resurfaced at the end of the day and they successfully pushed prices back to the opening level and to the day high.
Important factors:- The Umbrella pattern has the potential to signal a bullish reversal at the bottom if it appears after a long downtrend, a long black candlestick or if it is seen at a visible support level.
- Likewise; the Umbrella pattern may signal a bearish reversal at the market top if it appears after a long uptrend, a long white candlestick or if it is seen at a visible resistance level. Bearish or bullish confirmation is required in both situations.
Closing Marubozu
Marubozu
Opening Marubozu
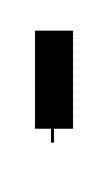
Long Candlestick
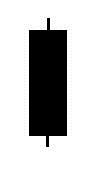
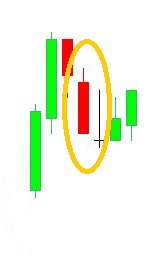
- A Black Closing Marubozu has an upper shadow.
- The day opens, prices slightly move up creating the upper shadow but then prices start moving down all day long creating the long black body.
- Then the day closes at the low of the day which explains the absence of the lower shadow.
Bearish Black Closing Marubozu: The Bearish Black Closing Marubozu pattern is a single candlestick pattern characterized by its long black body. It does not have a lower shadow but it has an upper shadow. It is an extremely strong bearish candlestick pattern.
Explanation: The Black Closing Marubozu pattern is a single candlestick pattern. As mentioned above; it is a long black body showing a shadow on the open but no shadow at close. This shows that the day opened and then prices initially went up but then they reversed direction moving below the opening level and finally closed at the low of the day. It is a day of the bears. With the bears in full force; it may show either the continuation of a downtrend or a final sell off attempt just before the bulls regain control.
Important factors:- A Black Closing Marubozu pattern can be either the initial phase of a bearish continuation pattern or it may signal a bullish reversal depending on the preceding day's candlesticks.
- The Black Opening Marubozu pattern is a single candlestick pattern with low reliability. It only reflects one day's trading and may be pointing either continuation or reversal. Hence it must be considered with other candlesticks to better judge the direction of the trend.
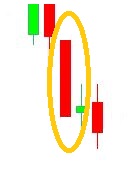
- A black Marubozu pattern is characterised by not having upper or lower shadows and by its long black body.
- It shows that the prices moved down all day long after the opening thus forming the long black body.
- Then the day closes at its lowest level that explains the absence of the lower shadow.
Bearish Black Marubozu: The Bearish Black Marubozu pattern is a single candlestick pattern characterized by a long black body. It does not have any shadows on either end. It is an extremely strong bearish candlestick pattern.
Explanation: A Black Marubozu forms when the opening price is equal to the high price of the day while the closing price is equal to the low price of the day. This shows that the sellers controlled the price action from the first trade to the last trade. When a Black Marubozu day occurs, the day opens and prices continue to move down all day long without stopping. It may show continuation of the downtrend or a final sell off attempt before the bulls regain control.
Important factors:- A Black Marubozu may be the initial phase of a bearish continuation pattern but it may also signal a bullish reversal depending on the preceding day's candlesticks.
- The Black Marubozu is a single candlestick pattern with low reliability. It reflects only one day’s trading with a potential to signal both continuation and reversal. It must be used with other candlesticks for the confirmation of a trend.
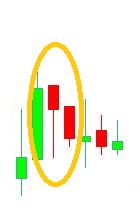
- A Black Opening Marubozu pattern has a lower shadow.
- The day opens and prices go below the opening price. Prices continue to move down all day thus forming the long black body.
- The closing price is below the opening price but not at the low of the day that gives us the lower shadow.
Black Opening Marubozu: The Black Opening Marubozu pattern is a single candlestick pattern characterised by a long black body, a lower shadow and absence of upper shadow. It is a strongly bearish candlestick pattern.
Explanation: The Black Opening Marubozu pattern is a single candlestick pattern characterised by its long black body, displaying a shadow on the closing side but no shadow on the opening side. This shows that the day opened and prices continuously went down but they did not close at the low of the day and thus they created a lower shadow. It is a day for bears and such a bearish rally should cause concern among the bulls.
Important factors:- A Black Opening Marubozu pattern may be interpreted either as the initial phase of a bearish continuation pattern or it may also signal a bullish reversal depending on the preceding day's candlesticks.
- In the case of an uptrend, a Black Opening Marubozu pattern is called as a Bearish Belt Hold pattern.
- The Black Opening Marubozu pattern is a single candlestick pattern with low reliability. It only reflects one day's trading and may be pointing either continuation or reversal. Hence it must be considered with other candlesticks to better judge the direction of the trend.
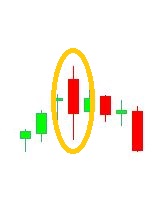
- The real body is black and it is relatively long.
- The sizes of the upper and lower shadows are not important.
Bearish Long Black Candlestick: The Bearish Long Black Candlestick pattern signals strong selling pressure in the market.
Explanation: Bearish Long Black Candlesticks are indicators of strong selling pressure. A longer black candlestick means that the close is further below the opening price. The prices decline significantly following the opening showing that sellers were aggressive. Long Black Candlesticks are generally bearish formations, however, their interpretation also depends on their position within the broader technical picture. A Long Black Candlestick may warn a turning point or mark a future resistance level after a long rally. However Long Black Candlestick may signal panic or capitulation if it appears after a long decline.
Important factors:- The Long Black Candlestick is a single candlestick pattern with low reliability. It only reflects one day's trading and may both be pointing out to continuation or reversal. Thus it requires consideration of other candlesticks to confirm a trend.